- Home
- :
- All Communities
- :
- Products
- :
- Mapping
- :
- Mapping Questions
- :
- Merging colors of two overlapping layers
- Subscribe to RSS Feed
- Mark Topic as New
- Mark Topic as Read
- Float this Topic for Current User
- Bookmark
- Subscribe
- Mute
- Printer Friendly Page
- Mark as New
- Bookmark
- Subscribe
- Mute
- Subscribe to RSS Feed
- Permalink
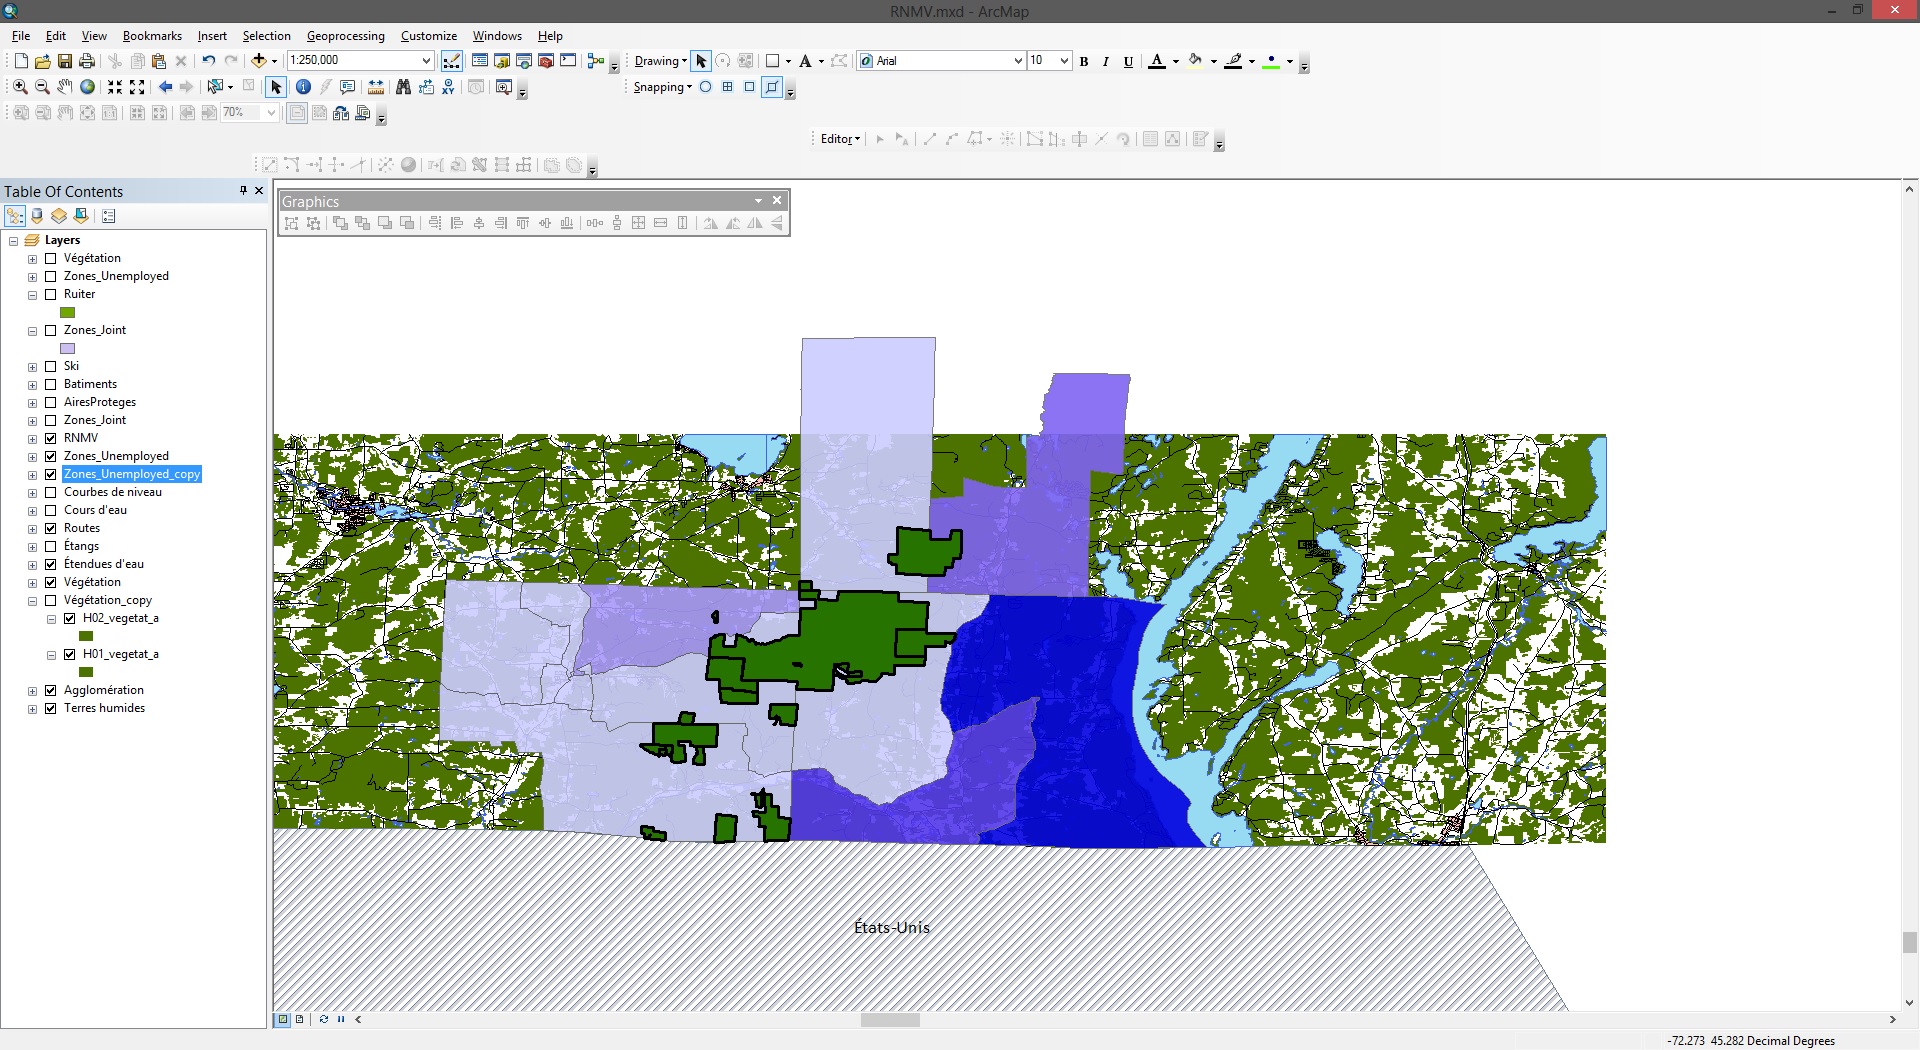
There's something i think that would be cool to do for a map presentation. I have a shapefile of unemployment rate represented using quantities symbology. Underneath that layer, there's a vegetation layer. I want the vegetation to be the same color as the unemployment rate layer where those two overlaps. Then I would hide the unemployment layer (wich are just big rectangle polygons) or maybe just keep the ouline.
Is that something possible. And do anybody understand why i'm trying to do? I attached a picture of my map, if it helps.
I tried messing with "Convert feature to graphics".
Solved! Go to Solution.
Accepted Solutions
- Mark as New
- Bookmark
- Subscribe
- Mute
- Subscribe to RSS Feed
- Permalink
Hi Gob,
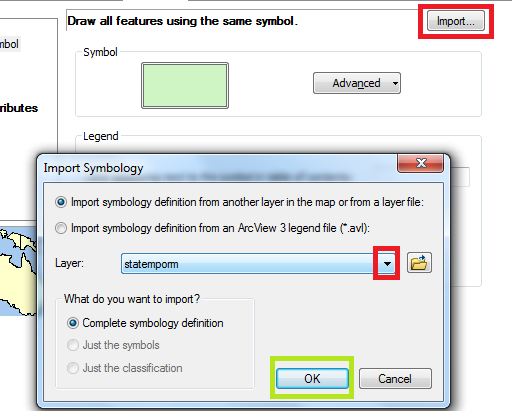
First of all, you can use Identity (Analysis) tool for these two layers (Input feature: Vegetation; Identity Feature: Unemployment_rate).
Then open the symbology (Layer Properties > Symbology) of the resulting Identity_layer. Import the symbology of the Unemployment_rate layer (see example below).
Thanks,
Jay
Think Location
- Mark as New
- Bookmark
- Subscribe
- Mute
- Subscribe to RSS Feed
- Permalink
Hi Gob,
First of all, you can use Identity (Analysis) tool for these two layers (Input feature: Vegetation; Identity Feature: Unemployment_rate).
Then open the symbology (Layer Properties > Symbology) of the resulting Identity_layer. Import the symbology of the Unemployment_rate layer (see example below).
Thanks,
Jay
Think Location