- Home
- :
- All Communities
- :
- Products
- :
- Mapping
- :
- Mapping Questions
- :
- How to make points vary in size AND color
- Subscribe to RSS Feed
- Mark Topic as New
- Mark Topic as Read
- Float this Topic for Current User
- Bookmark
- Subscribe
- Mute
- Printer Friendly Page
- Mark as New
- Bookmark
- Subscribe
- Mute
- Subscribe to RSS Feed
- Permalink
Hello community,
For a class project, I went out on campus and collected GPS coordinates for various trees. I also recorded their DBH values. On ArcGIS, I mapped the points over an aerial map of my campus. This is what I have as a result:
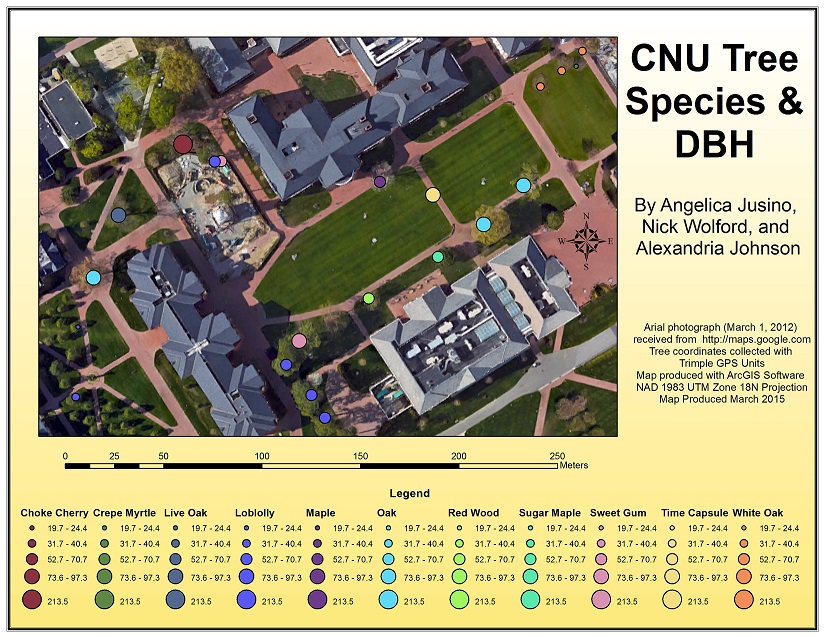
What I want is one section in my legend listing the tree species and their appropriate colors. In another section, I want just one of the lines of varying sizes of symbols. Is this possible?
Solved! Go to Solution.
Accepted Solutions
- Mark as New
- Bookmark
- Subscribe
- Mute
- Subscribe to RSS Feed
- Permalink
A couple of options come to mind.
1. Convert the legend to graphics, ungroup and edit the parts. But once you convert it to graphics it's no longer live and won't update if the data changes.
2. Add a couple of "dummy" layers to the map, one to represent the species and another to represent the sizes. Turn them off so they don't show in the map, but turn them on in the legend in place of the legend item for your actual layer. More work to set up, but the legend will remain live.
- Mark as New
- Bookmark
- Subscribe
- Mute
- Subscribe to RSS Feed
- Permalink
Thank you so much! I'm going to use the layering idea. As soon as I get it I'll post my results!
- Mark as New
- Bookmark
- Subscribe
- Mute
- Subscribe to RSS Feed
- Permalink
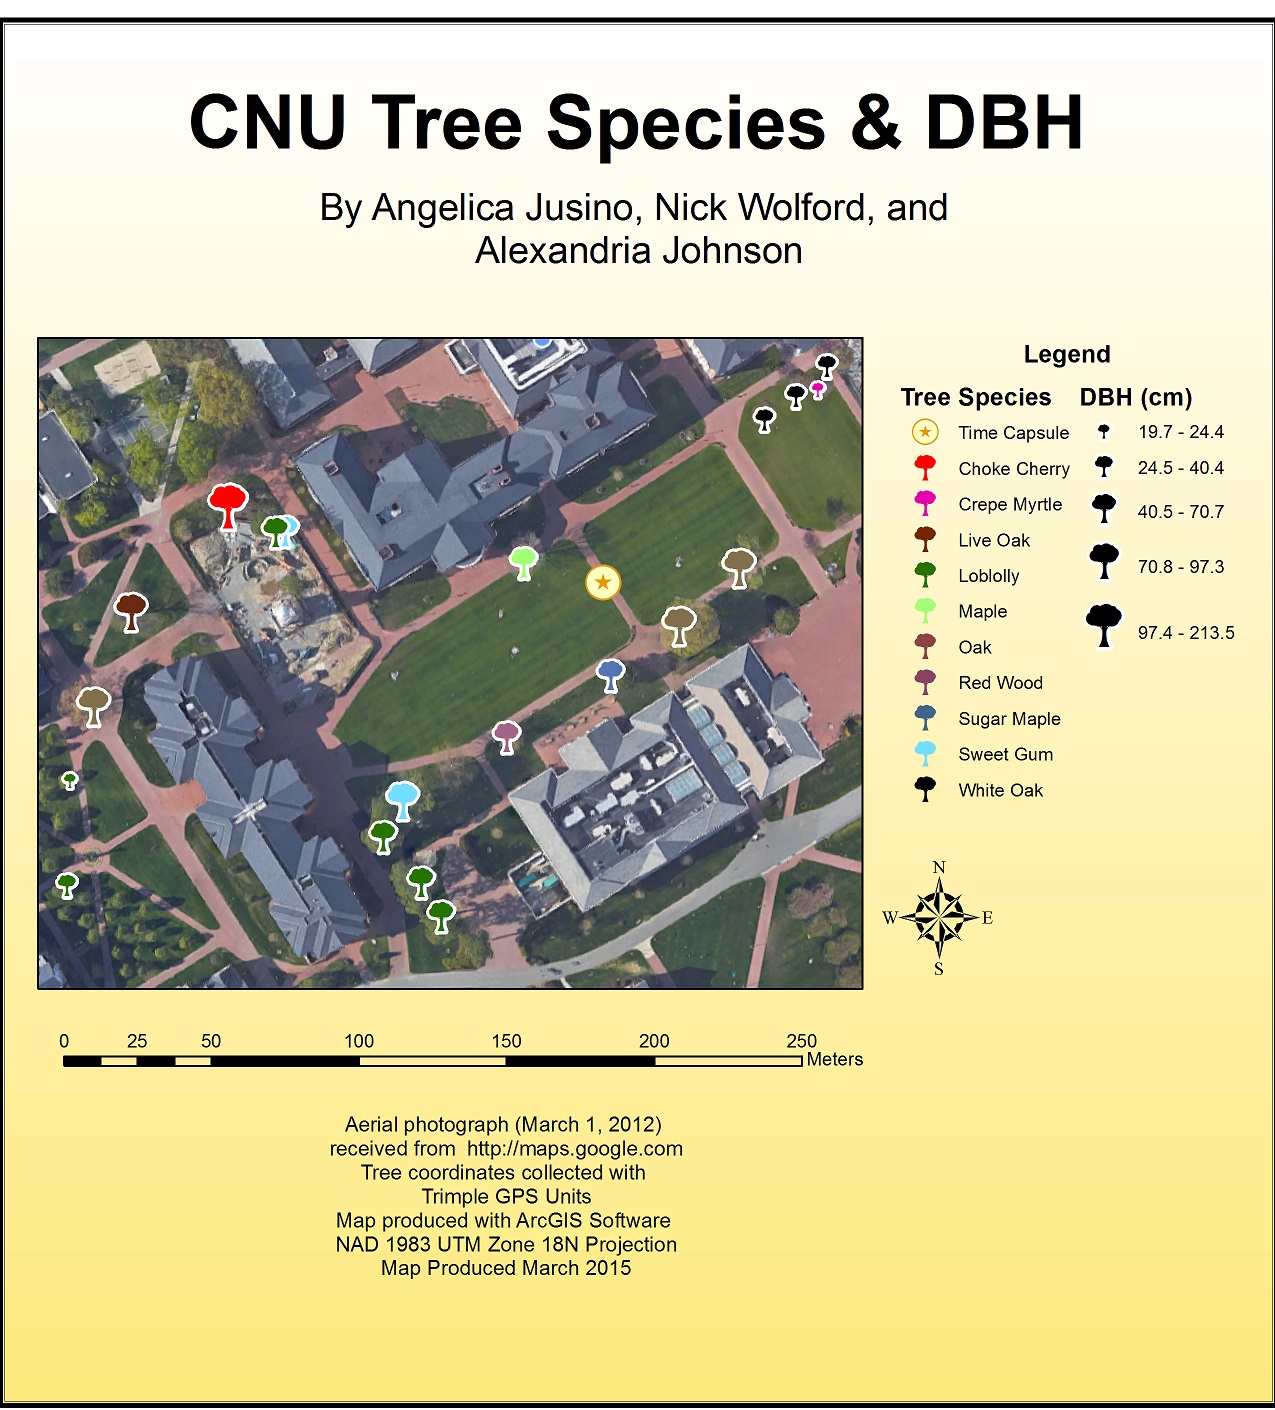
Thank you to David Barnes for the help! Here's my new output - EXACTLY as I want it!!
- Mark as New
- Bookmark
- Subscribe
- Mute
- Subscribe to RSS Feed
- Permalink
Nice, Angelica! Thanks for sharing your map!
Glad I could help. 