

- Subscribe to RSS Feed
- Mark as New
- Mark as Read
- Bookmark
- Subscribe
- Printer Friendly Page
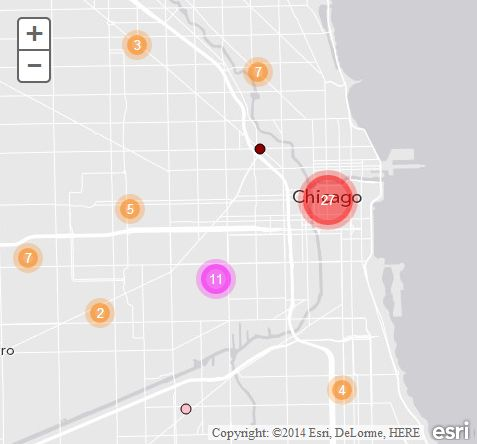
I made a similar blog post not too long ago, but thought I might share this here. Clustering of point data is a pretty neat way of being able to deal with displaying large amounts of data on a map in a simple way. This capability is a staple in the Flex and Silverlight Esri APIs, but the JS API has not gotten the same sort of love.
The Esri Solution
The Esri solution is a neat little module used in this sample you can download and customize as needed. This works pretty nicely and I have seen it used in quite a few apps that Esri puts out. It's not part of the core API, mainly because the use cases can differ so much as to what someone wants to do with it. It doesn't link directly to a map service, as it requires you to provide it a data source of coordinates and customize the behavior from there. Which works pretty well if you are dealing with spreadsheets of data that has x/y locations associated with it, ala GPS data. But I needed something a little more flexible (in my opinion) that could take my existing FeatureServices or regular Dynamic Map Services and act more like a FeatureLayer. So I did what any good dev would do. I stole their stuff and tweaked it.
The ClusterFeatureLayer
With the ClusterLayer code in hand, I started chipping away at the innards, taking out stuff I didn't need and Frankensteining together features I did need. It started simply enough, rigging it to take in a FeatureService URL or a MapService URL and using that as the source for the point data. That wasn't too hard, although it was a little slow. So I took (stole) some stuff the FeatureLayer where I would load the data via multiple requests using objectids1000 at a time and cache the data. Then I added options to either download all the data at once or as needed, ala MODE_SNAPSHOT in the FeatureLayer module.
The Beast
You can view the project on github here. There are some details in the README and more details in the comments to the code. There has already been a few contributions to the code, which is the beauty of github. You can view a demo of basic clustering here. Did I also mention that it will accept services with polygon geometries and convert them to points and cluster them for you? Yeah, it can do that too.
Pleas feel free to log issues or contributes. I'm currently testing out some options to try and speed up some bottlenecks and generally refactor the code.
You must be a registered user to add a comment. If you've already registered, sign in. Otherwise, register and sign in.