Turn on suggestions
Auto-suggest helps you quickly narrow down your search results by suggesting possible matches as you type.
Cancel
- Home
- :
- All Communities
- :
- Products
- :
- Data Management
- :
- Data Management Questions
- :
- Problems with netcdf data coordinates
Options
- Subscribe to RSS Feed
- Mark Topic as New
- Mark Topic as Read
- Float this Topic for Current User
- Bookmark
- Subscribe
- Mute
- Printer Friendly Page
Problems with netcdf data coordinates
Subscribe
6762
3
10-09-2011 09:24 PM
10-09-2011
09:24 PM
- Mark as New
- Bookmark
- Subscribe
- Mute
- Subscribe to RSS Feed
- Permalink
Hello,
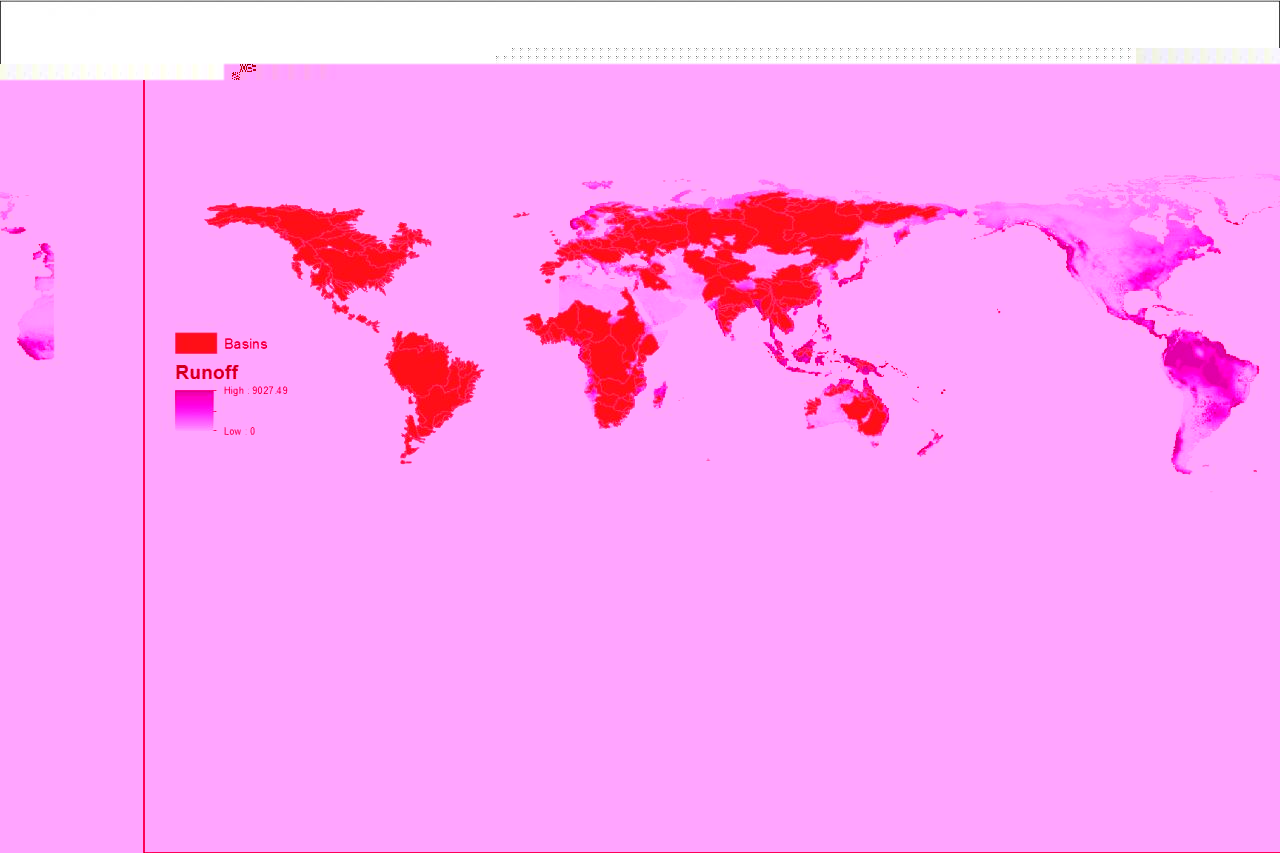
I have created a netcdf file in matlab and am trying to display and process it in ArcMap. I need to overlay it with a shapefile that uses the GCS_WGS_1984 projection and has longitude ranging from -180 to 180. My original netcdf file had a longitude vector ranging from 0.25 to 359.75 so only the positive longitudes could be overlaid with the shapefile (see image attached, netcdf file in blue). I changed the longitude vector to the following format:
0.25
0.75
..
..
..
179.75
-179.75
..
..
..
-0.75
-0.25
I was hoping this would allow me to overlay the shapefile and the netcdf file, and also have the zero latitude (greenwich) in the middle instead of the pacific. The file I created displays fine in Panoply so it is not corrupted or have a faulty coordinate system. However, ArcMap only displays one data point when I open the file and the attribute table only has one line with information FID 0, Shape point, Runoff 0. When I try to convert this netcdf file into a raster I get the following error: ERROR 000276: one or both dimensions have variable spacing in their coordinate values. This happens despite the fact that the longitude vector is spaced at regular 0.5 degree intervals and has 720 values just like the original vector.
I'm confused as to why ArcMap cannot read this file and have run out of ideas on how to overlay the two datasets. The latitude vector is clearly fine but I do not know how I should format longitude for ArcMap to understand it and display negative (western) longitudes in the left and positive (eastern) longitudes in the right. Any help would be greatly appreciated!
3 Replies
10-19-2011
04:10 AM
- Mark as New
- Bookmark
- Subscribe
- Mute
- Subscribe to RSS Feed
- Permalink
Hi
Did you ever receive any help or even solve the problem with displaying netCDF data as I'm experiencing the same problem.
Best wishes, Simon.
Did you ever receive any help or even solve the problem with displaying netCDF data as I'm experiencing the same problem.
Best wishes, Simon.
11-15-2012
07:48 AM
- Mark as New
- Bookmark
- Subscribe
- Mute
- Subscribe to RSS Feed
- Permalink
Hi
Did you ever solve this problem I ma running in the same problem
Any help is greatly appreciated. My netcdf displays fine in panoply but ArcMap can't import the data.
Catalina
Did you ever solve this problem I ma running in the same problem
Any help is greatly appreciated. My netcdf displays fine in panoply but ArcMap can't import the data.
Catalina
07-02-2014
12:13 PM
- Mark as New
- Bookmark
- Subscribe
- Mute
- Subscribe to RSS Feed
- Permalink
The variable spacing in the data is caused when every space within the raster is not assigned a value. Even no data areas need to be assigned no data in order for ARCMAP to read it. So ArcMap can read rasters and convert to NETCDF which it can use, but the dataset has to be complete. I struggled with this for a few days before trying something else. I used QGIS (sorry ESRI, it was necessary) to open the NETCDF without any problem. You can then save the NETCDF as a Geotiff and open it in ArcMap to do whatever other processing or visualization that is necessary.
Best of luck
Best of luck