- Home
- :
- All Communities
- :
- User Groups
- :
- Coordinate Reference Systems
- :
- Questions
- :
- Shapefile not overlaying with other layers even th...
- Subscribe to RSS Feed
- Mark Topic as New
- Mark Topic as Read
- Float this Topic for Current User
- Bookmark
- Subscribe
- Mute
- Printer Friendly Page
Shapefile not overlaying with other layers even though same projection
- Mark as New
- Bookmark
- Subscribe
- Mute
- Subscribe to RSS Feed
- Permalink
I have a CSV file with point location data.
I added this CSV file to ArcMap then clicked on Display XY data to make it into an Event layer. I then exported this into a shapefile (then exported it again based on a criteria I have using the Select By Attributes tool).
The problem is that the shapefile is not overlaying with other layers even though they are in the same projection.
The data frame is in Web Mercator (which is what I need the layers to be).
When I click on Display XY data, I get the following image, meaning that ArcMap has recognized that my data frame is in Web Mercator and is automatically adding this projection to the Event layer.
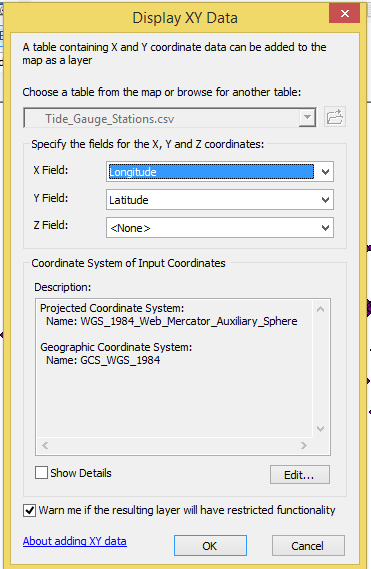
The shapefile has these extents and info:
| Projected Coordinate System: | WGS_1984_Web_Mercator_Auxiliary_Sphere |
| Projection: | Mercator_Auxiliary_Sphere |
| False_Easting: | 0.00000000 |
| False_Northing: | 0.00000000 |
| Central_Meridian: | 0.00000000 |
| Standard_Parallel_1: | 0.00000000 |
| Auxiliary_Sphere_Type: | 0.00000000 |
| Linear Unit: | Meter |
| Geographic Coordinate System: | GCS_WGS_1984 |
| Datum: | D_WGS_1984 |
| Prime Meridian: | Greenwich |
| Angular Unit: | Degree |
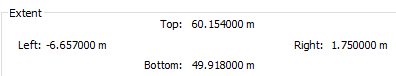
The points are located around the UK and this is how far off they are from each other:
(You would be able to see the points if you zoom into the one dot. I know they are in the UK because the points have the country's shape).

- Mark as New
- Bookmark
- Subscribe
- Mute
- Subscribe to RSS Feed
- Permalink
This is a common issue when working with CSV data. When you use "Display XY Data," ArcMap assumes the coordinates match the data frame's CRS (often Web Mercator), but CSV coordinates are usually in WGS84 (lat/lon degrees).
- it will preview your data on a basemap. If your points appear scrunched near the equator (0,0), that's a clear sign the coordinates are being interpreted as meters when they're actually degrees.
The fix is to ensure the correct CRS (usually WGS84/EPSG:4326 for CSV data) is specified when you first display the XY data, before exporting to shapefile.
A quick way to verify the issue is to upload your shapefile to Projection Finder
- « Previous
-
- 1
- 2
- Next »
- « Previous
-
- 1
- 2
- Next »