- Home
- :
- All Communities
- :
- User Groups
- :
- Coordinate Reference Systems
- :
- Questions
- :
- Shapefile not overlaying with other layers even th...
- Subscribe to RSS Feed
- Mark Topic as New
- Mark Topic as Read
- Float this Topic for Current User
- Bookmark
- Subscribe
- Mute
- Printer Friendly Page
Shapefile not overlaying with other layers even though same projection
- Mark as New
- Bookmark
- Subscribe
- Mute
- Subscribe to RSS Feed
- Permalink
I have a CSV file with point location data.
I added this CSV file to ArcMap then clicked on Display XY data to make it into an Event layer. I then exported this into a shapefile (then exported it again based on a criteria I have using the Select By Attributes tool).
The problem is that the shapefile is not overlaying with other layers even though they are in the same projection.
The data frame is in Web Mercator (which is what I need the layers to be).
When I click on Display XY data, I get the following image, meaning that ArcMap has recognized that my data frame is in Web Mercator and is automatically adding this projection to the Event layer.
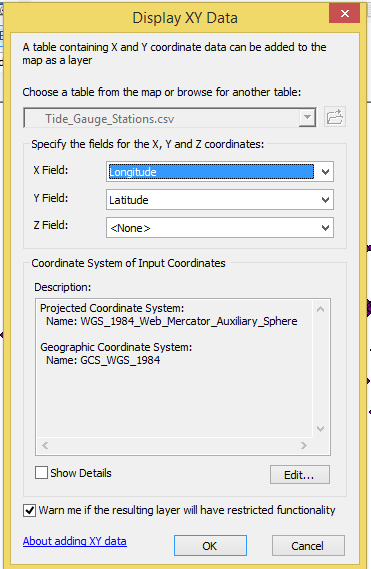
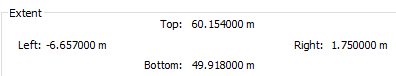
The shapefile has these extents and info:
| Projected Coordinate System: | WGS_1984_Web_Mercator_Auxiliary_Sphere |
| Projection: | Mercator_Auxiliary_Sphere |
| False_Easting: | 0.00000000 |
| False_Northing: | 0.00000000 |
| Central_Meridian: | 0.00000000 |
| Standard_Parallel_1: | 0.00000000 |
| Auxiliary_Sphere_Type: | 0.00000000 |
| Linear Unit: | Meter |
| Geographic Coordinate System: | GCS_WGS_1984 |
| Datum: | D_WGS_1984 |
| Prime Meridian: | Greenwich |
| Angular Unit: | Degree |
The points are located around the UK and this is how far off they are from each other:
(You would be able to see the points if you zoom into the one dot. I know they are in the UK because the points have the country's shape).

- Mark as New
- Bookmark
- Subscribe
- Mute
- Subscribe to RSS Feed
- Permalink
your file is in a geographic coordinate system...aka decimal degrees... you have to define it as such and save it as a feature class in a geodatabase or as a shapefile. Once it is defined properly, you can project it to your web projection.
PS do this in an empty data frame without any other data added so things don't get confused
- Mark as New
- Bookmark
- Subscribe
- Mute
- Subscribe to RSS Feed
- Permalink
Do you mean the extents? They are in metres.
- Mark as New
- Bookmark
- Subscribe
- Mute
- Subscribe to RSS Feed
- Permalink
the extent values are erroneous and only reflect the coordinates of the data frame which got them from the first layer added. The file you added does not have a defined coordinate system and "it" assumed that the coordinates were the same...so ignore the meters designation...you have deimal degree data, which is why the data shows up near the equator all scrunched up.
- Mark as New
- Bookmark
- Subscribe
- Mute
- Subscribe to RSS Feed
- Permalink
Ok. Just so I understand, you are suggesting that I need to use Define Projection on the shapefile to a GCS (like WGS84) then use Project to change it to Web Mercator?
What about the fact that when I click on "Display XY Data", it automatically takes in Web Mercator (or this doesn't matter? I should just do the above process?)
- Mark as New
- Bookmark
- Subscribe
- Mute
- Subscribe to RSS Feed
- Permalink
If the csv file had coordinates in the range -180 to 180 for X (aka longitude) and -90 to 90 for Y (aka latitude)
what do you think the coordinate are in? decimal degrees? WGS84? collected from a gps that defaults to that. OR do think that it is a projected coordinate system whose units are meters?
You could be bold and give my suggestion a try and see what happens... tell it what it is first...then change it
- Mark as New
- Bookmark
- Subscribe
- Mute
- Subscribe to RSS Feed
- Permalink
The display xy data tool defaults the coordinate system to the whatever the data frame is using. If you have a base map loaded, that's usually EPSG:3857 aka Web Mercator.
For data in a csv or text file, it's almost never Web Mercator but latitude/longitude values in degrees. I keep meaning to ask the mapping team about changing the default, or at least making it smarter, but haven't gotten around to it yet.
When you open the display xy data tool, just change the coordinate system from the default to geographic coordinate systems, work, WGS 1984. Or when you click the Edit button on the coordinate system, type in 4326.
Melita
- Mark as New
- Bookmark
- Subscribe
- Mute
- Subscribe to RSS Feed
- Permalink
Hi Eninna Luli, If they don't overlapping i would try to project the shp in another coordinate system. You can try too, display XY data from an empty mxd + basemap and define here the projection (maybe WGS84) and see if it works. If you want, send me the file in order to take a look and to try to figure what is happening, Hope it helps Best regards, FE
- Mark as New
- Bookmark
- Subscribe
- Mute
- Subscribe to RSS Feed
- Permalink
Felipe, How can I send you the file?
- Mark as New
- Bookmark
- Subscribe
- Mute
- Subscribe to RSS Feed
- Permalink
By email (see profile) or you can upload here (public place).