- Home
- :
- All Communities
- :
- Products
- :
- ArcGIS Spatial Analyst
- :
- ArcGIS Spatial Analyst Questions
- :
- Creating Population Density Raster from Point Data...
- Subscribe to RSS Feed
- Mark Topic as New
- Mark Topic as Read
- Float this Topic for Current User
- Bookmark
- Subscribe
- Mute
- Printer Friendly Page
Creating Population Density Raster from Point Data Accurately
- Mark as New
- Bookmark
- Subscribe
- Mute
- Subscribe to RSS Feed
- Permalink
Dear All,
I am trying to create a density map from points that show values of population density. I would like to know how i can accurately create a raster from theses points such that the areas where the points are, is accurately represented and areas where there are no points are low or null, I would like my density points to look similar to the the density map show in the attachment. what tools would i need to use.
Regards
John
- Mark as New
- Bookmark
- Subscribe
- Mute
- Subscribe to RSS Feed
- Permalink
Well... the density toolset is here An overview of the Density toolset—Help | ArcGIS for Desktop
As for the 'accuracy'? setting aside issues or representation associated with cell size and general raster configurations. I would vote no, simply because you have vast tracts of land where there are no observations. For example, the clustering of points along the western border... Lots of data there, but what about the big empty holes elsewhere? A standard choropleth map (ie population symbolized at the polygon level) would be a bit of a stretch in itself.
So, my questions are...
- why do you want to create a population density map for an area with so few observation points?
- Is there no other data available for the communities in the study area?
- Are those points just a sample of the available locations in # 2 ?
- the general purpose.... other than the desire for a population density map... ie what is to be used for and who is the intended audience?
That's all I can think of for now.
- Mark as New
- Bookmark
- Subscribe
- Mute
- Subscribe to RSS Feed
- Permalink
Hi Dan,
Thank you for your response, those were household data as part of a census, i would like to calculate the distribution of population density as well as other factors such as number of people per household, income levels etc for those households areas and locations on the map of Mauritius. I tried to use IDW, Spline,Krigging, etc.. but interpolation of those values were not giving an accurate depiction, any idea what tools i could use to display them.
- Mark as New
- Bookmark
- Subscribe
- Mute
- Subscribe to RSS Feed
- Permalink
The example you posted of France (price per m²) is not an interpolation. Basically it is an aggregation of data within an administrative unit. Since there are many, it looks very good. In your case you have like 9 units, and aggregating the population per unit and calculate average population per km² will not look the same as the map from France.
Using the point or kernel density tools, you may simulate something like population density, but remember that each point indicates a number of people and there you don't have one point dot per person (which would be a lot more accurate to get the distribution of the density). For a smoother result I would recommend Kernel Density—Help | ArcGIS for Desktop , but you will not get an "accurate" result.
- Mark as New
- Bookmark
- Subscribe
- Mute
- Subscribe to RSS Feed
- Permalink
I have tried all that, how would i go about estimating the size or the distance i should utilize? when it comes to point and kernel density calculations.
- Mark as New
- Bookmark
- Subscribe
- Mute
- Subscribe to RSS Feed
- Permalink
What results did you get, can you post a screenshot? If you choose your search distance to small, it will treat the points as isolated and the result will not be very good. Make it big enough that in the denser areas at least a few points are included.
- Mark as New
- Bookmark
- Subscribe
- Mute
- Subscribe to RSS Feed
- Permalink
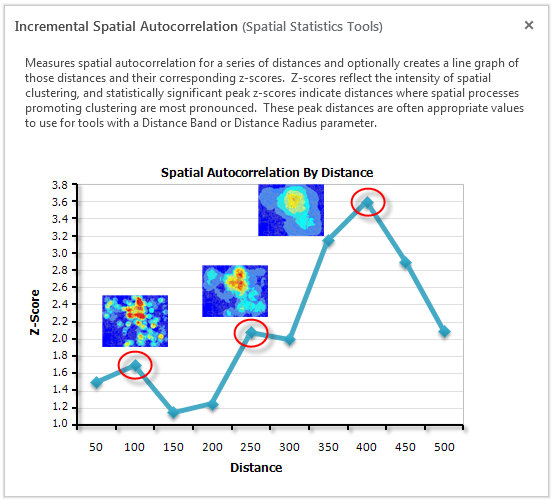
You should consider using the Incremental Spatial Autocorrelation tool in the Spatial Statistics toolset to find the distance band appropriate or meaningful for your data. "The peak distance values are often appropriate values to use for tools with a Distance Band ... " Do see http://pro.arcgis.com/en/pro-app/tool-reference/spatial-statistics/incremental-spatial-autocorrelati...
Incremental Spatial Autocorrelation