- Home
- :
- All Communities
- :
- Products
- :
- ArcGIS Pro
- :
- ArcGIS Pro Questions
- :
- How can I find the percentage of change of a 30 me...
- Subscribe to RSS Feed
- Mark Topic as New
- Mark Topic as Read
- Float this Topic for Current User
- Bookmark
- Subscribe
- Mute
- Printer Friendly Page
How can I find the percentage of change of a 30 meter resolution raster, within a buffer area (250 meters in my case) from point locations?
- Mark as New
- Bookmark
- Subscribe
- Mute
- Subscribe to RSS Feed
- Permalink
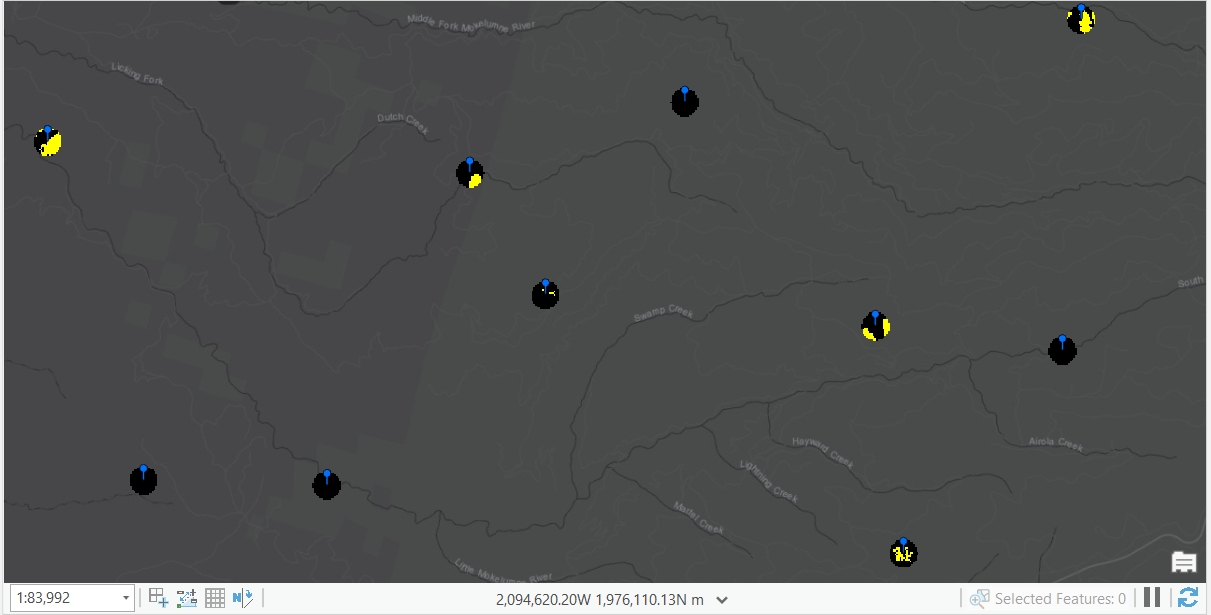
How could I find the percentage of change for each buffer area in the image below using ArcGIS Pro 2.5.0? I want to be able to show the percentage of change for each "unique" buffer/circle, so that I can create a histogram or some type of similar graph. The blue pins are point locations, the general circles are 250 meter buffers from the point locations, the yellow cells are equal to change, and the dark black cells are equal to no change.
Solved! Go to Solution.
Accepted Solutions
- Mark as New
- Bookmark
- Subscribe
- Mute
- Subscribe to RSS Feed
- Permalink
I would try
Zonal Statistics as Table (Spatial Analyst)—ArcGIS Pro | Documentation
as a first try... make sure you check
How the zonal statistics tools work—ArcGIS Pro | Documentation
for comments ad refinement details
... sort of retired...
- Mark as New
- Bookmark
- Subscribe
- Mute
- Subscribe to RSS Feed
- Permalink
Thank you for that information Dan, I appreciate it and it was very helpful. So I think I was able to get the overall statistics of "Change" (which shows as LnCvrTruFls = 1) and "No Change" (LnCvrTruFls = 0) when I ran the Zonal Statistics as Table tool:

This information is definitely useful for my project, but I am still not reaching my final goal of showing the percentage of change for each Individual and Unique buffer circle (which was derived from a unique point location). Should I go about making my buffer circles differently? Or should I use a different tool or different tools to get the percentage change for each Individual and Unique buffer circle?
FYI and incase it might help, I had created 250 meter buffers from the point location, then used the Extract By Mask tool to get only the Raster Cells within the 250 meter buffered area, then I used Extract By Mask again to get the bien_250m_buffer circles that were within the flights path (which I called ExtractFlights_LandCoverChange01to16 in my Contents Pane). This is the final raster that I am trying to get percentage of change and no change...
- Mark as New
- Bookmark
- Subscribe
- Mute
- Subscribe to RSS Feed
- Permalink
When you made your buffers, did you have them as individual zones?
... sort of retired...
- Mark as New
- Bookmark
- Subscribe
- Mute
- Subscribe to RSS Feed
- Permalink
Ah yes that is my issue, I am trying to figure out now how to have the object id's transfer when I create the buffers from my point features.
- Mark as New
- Bookmark
- Subscribe
- Mute
- Subscribe to RSS Feed
- Permalink
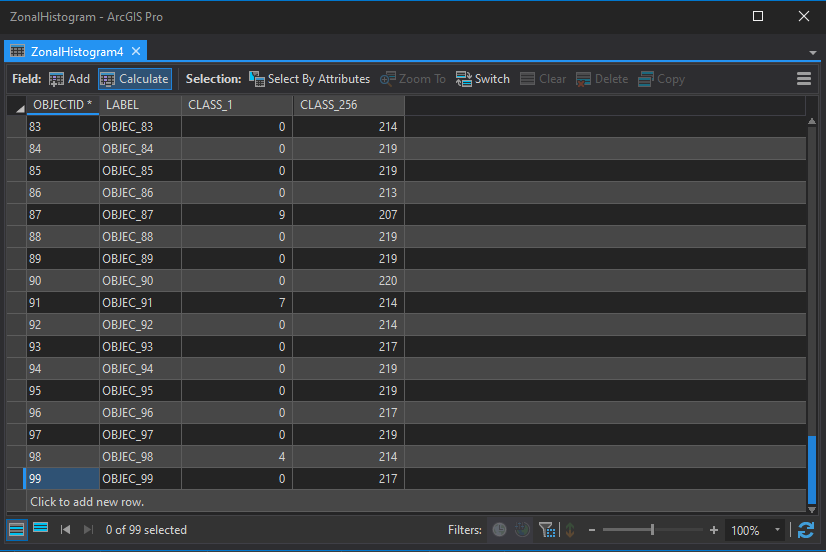
I was able to get most of my point features buffered with their own OBJECTID's (individual zones). My buffered feature class now has over 900 OBJECTID's, but when I run the Zonal Histogram tool with the ESRI Grid raster "LandCoverChange_2001to2016_onlyTryFls" the tool causes Pro to crash. But if I use it with a GeoTIFF "nlcd.change.2016.2001.tif" it works, but the output table produced only shows 99 OBJECTID's. Does the Zonal Histogram have a limit on how much data it will analyze?
I included an image showing what I am working with in Pro:

This image shows the Zonal Histogram table produced with only 99 OBJECTID's:
I was thinking of trying to convert my ESRI Grid or the GeoTIFF to a more simple binary raster (if that is further possible), then maybe do the Zonal Histogram analysis for the 6 different major flight paths areas, individually.
Thanks again for all the help so far, I really appreciate it.
- Mark as New
- Bookmark
- Subscribe
- Mute
- Subscribe to RSS Feed
- Permalink
I was able to complete my final goal by running Zonal Histogram with "Zones as rows in output table" unchecked. I then saved the output table as a .csv, converted it to an excel file in Microsoft Excel, then simply copy and transform pasted the data. I was then able to load the excel file and join it to my buffered point feature.