- Home
- :
- All Communities
- :
- Products
- :
- ArcGIS Pro
- :
- ArcGIS Pro Questions
- :
- Contour Lines from Polygon
- Subscribe to RSS Feed
- Mark Topic as New
- Mark Topic as Read
- Float this Topic for Current User
- Bookmark
- Subscribe
- Mute
- Printer Friendly Page
Contour Lines from Polygon
- Mark as New
- Bookmark
- Subscribe
- Mute
- Subscribe to RSS Feed
- Permalink
Hello everyone,
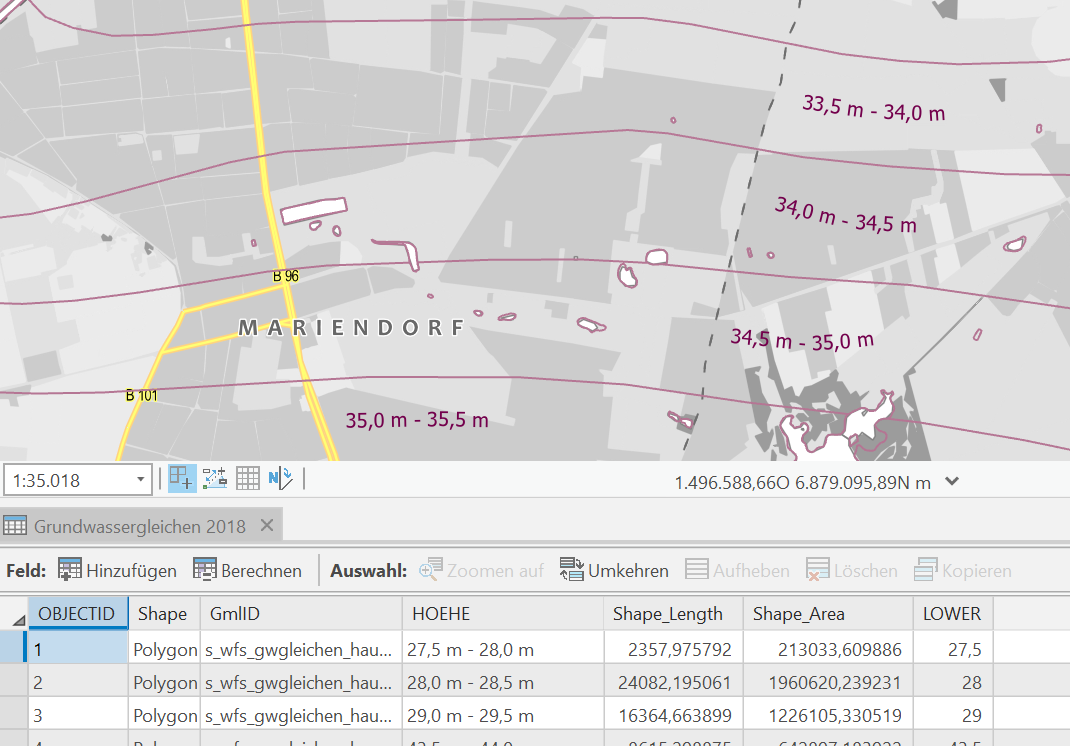
I have a dataset showing groundwater tables as polygons. The attribute table contains a column with a range of water levels (for example "30.5 m - 31.0 m").
I am trying to label the contours with the water level at their respective isolines. So far I only created columns containing the lower and upper bounds but I am lost when it comes to label placement.
Does anyone know how to accomplish this? Any help would be appreciated.
- Mark as New
- Bookmark
- Subscribe
- Mute
- Subscribe to RSS Feed
- Permalink
Have you converted the polygons to lines? Polygon To Line—Data Management toolbox | Documentation
Are you trying to label the "contour" as a polygon?
Can you show a screenshot?
- Mark as New
- Bookmark
- Subscribe
- Mute
- Subscribe to RSS Feed
- Permalink
I would go with George Thompson but take it a small step further and spatially join those lines and then use a field calculation to take the minimum value of the two fields and then the value after the dash. Also ensure the code doesn't hiccup on a line with no matching join, such as the outer line of the enclosing polygon.
It just takes a bit of python index slicing and .split() method etc.
Feature 1 - Join Field - 0-10m, 10-20m -->10m
- Mark as New
- Bookmark
- Subscribe
- Mute
- Subscribe to RSS Feed
- Permalink
Hey, thanks for taking a look at this.
I tried the conversion to lines but this resulted in loss of the elevation attributes. But even if I managed to keep those, since right now each contour line consists of the outlines of two polygons, wouldn't the conversion to lines result in 2 overlapping lines each containing different elevation values?
What I am trying to achieve is a regular contour map with values written on contour lines like this:

what I have is this:
- Mark as New
- Bookmark
- Subscribe
- Mute
- Subscribe to RSS Feed
- Permalink
It's disappointing the tool doesn't transfer attributes, but these can be restored with a table join afterwards if 'identify and store polygon neighbour information' is unchecked.
yes, 2 overlapping lines should be created if the checkbox is unticked. You can approach it wither way by retaining the neighbour information, but I think this is a more understandable workflow.
Spatial Join - Join the lines to themselves and each will get the height attributes of the intersecting line.
Afterwards field calculate a new field showing the values of both heights e.g !HOEHE! + ", " + "!HOEHE_1"
then run a new field calculation to return the highest value from the lowest range.
export as new features without the join field and delete identical.
- Mark as New
- Bookmark
- Subscribe
- Mute
- Subscribe to RSS Feed
- Permalink
Thanks for the Help,
unfortunately I wasn't able to execute your guidance successfully. A new problem arose with intersecting waterways. The Polygons are cut at waterways which causes lines of different elevation levels to be drawn as a single feature.
I will revisit again in the future but after having spend a good amount on hours yesterday and today on this I will be giving up for now.