- Home
- :
- All Communities
- :
- Products
- :
- ArcGIS Pro
- :
- ArcGIS Pro Questions
- :
- adding range to legend in arcgis pro
- Subscribe to RSS Feed
- Mark Topic as New
- Mark Topic as Read
- Float this Topic for Current User
- Bookmark
- Subscribe
- Mute
- Printer Friendly Page
adding range to legend in arcgis pro
- Mark as New
- Bookmark
- Subscribe
- Mute
- Subscribe to RSS Feed
- Permalink
Hello,
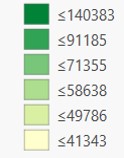
I am trying to add range to the legend in Pro for the data I am working on; but don't see any options to manipulate the legend, except for the manual editing of the legend. In ArcMap this was the default for most data displayed in layout and legend. The data I am working on is annual income by county. I have attached ArcMap and Pro legend images. I would appreciate any help in this matter.
Mehrshad
- Mark as New
- Bookmark
- Subscribe
- Mute
- Subscribe to RSS Feed
- Permalink
Hello Mehrshad.
It looks like you are using graduated colors symbology? There are a few ways you can change the range of what you see in the legend in ArcGIS Pro.
To change actual values, on the Symbology pane, on the Classes tab, click the Upper value cells to type new values. Alternatively, you can change the symbol class boundaries by click-dragging the boundary values on the Histogram tab.
To change the wording or formatting of the labels (without changing class boundaries), on the Classes tab, click a cell in the Label column and type a new label.
Optionally, click the More menu and click Show values out of range to add a symbol class for any features that fall outside of your defined range.
See Graduated colors—ArcGIS Pro | ArcGIS Desktop for more information. I hope this helps.
Edie
- Mark as New
- Bookmark
- Subscribe
- Mute
- Subscribe to RSS Feed
- Permalink
This doesn't really address the question. Would prefer not to have to manually add the range values. Should be default like in ArcMap or at least an easy configure option.
- Mark as New
- Bookmark
- Subscribe
- Mute
- Subscribe to RSS Feed
- Permalink
Yes, please fix this issue. Or at least tell us the format string to generate range labels. Thanks!