- Home
- :
- All Communities
- :
- Products
- :
- ArcGIS Pro
- :
- ArcGIS Pro Ideas
- :
- Set symbology’s lower value manually in ArcGIS PRO
- Subscribe to RSS Feed
- Mark as New
- Mark as Read
- Bookmark
- Follow this Idea
- Printer Friendly Page
Set symbology’s lower value manually in ArcGIS PRO
- Mark as New
- Bookmark
- Subscribe
- Mute
- Subscribe to RSS Feed
- Permalink
Lower class value of the lowest class cannot be manually changed (it was the same in ArcGIS).
You can update by choosing advanced-> sample size-> set sample size up, if you have not chosen “manual interval”. If you have chosen “manual interval”, not even that will work. If you realize too late that not all your data is covered or want to import symbology, there is no way around to set all class values manually again. There is no option only to update the lower value. The new sampling will always change the class values based on the chosen method and the new histogram.
You can actually set the upper value of the first class lower than the automatically estimated lower value. This is different from ArcGIS and changes the situation from being annoying to being a bug.
The new thing is that you can add “out of range” as a new feature in pro, but again the same, there is no way to update the range once you are in manual interval, you can change the upper value for the lowest interval, but the data will be shown as out of range and that is wrong and a bug.
The preferred solution is to be able to set the lower value manually, than you do not need to update with large samples and you can prepare the symbology for possible future lower values in dynamic data. Additionally, it would be easier to move the sampling from the advanced to the histogram-menu.
In the example I imported symbology from another layers based on latitude onto the column longitude. It is completely out of range, but normally I would want to keep the class limits. I calculated the statistics for the lon column in the table and then chose an upper value which definitely lies in the range of Lon. I added out of range symbols, otherwise the map would be simply white. The points would not be selectable. Choosing to update the range during support would change all class limits when anautomatic classification was chosen in the original layer and not update when "maual interval" is chosen.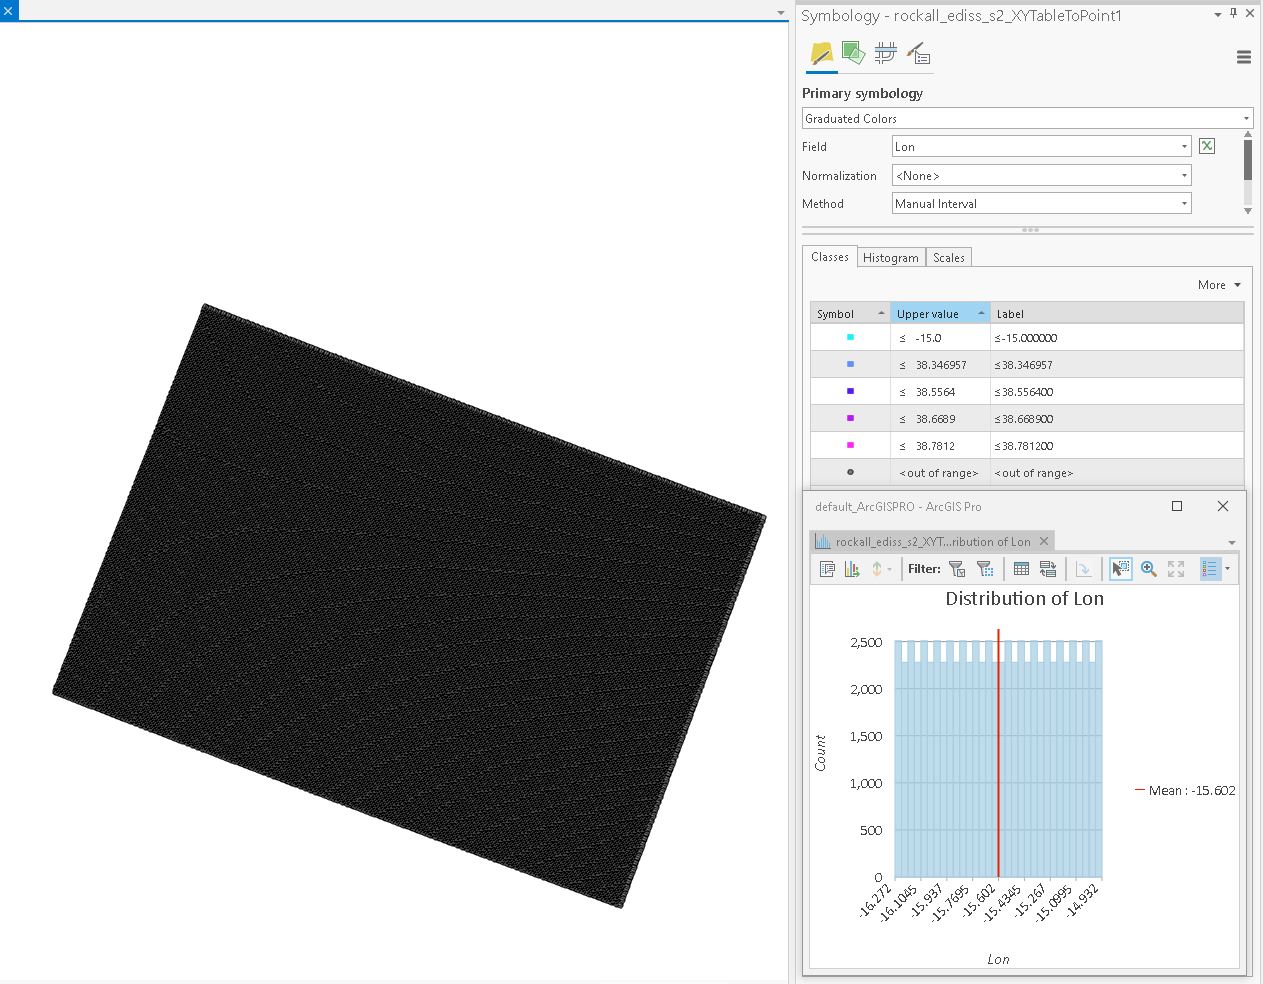
- « Previous
-
- 1
- 2
- Next »
I agree with @MaxMolello , @CraigWilliams answer actually works, but it is not obvious, that the values in the histogram are editable . Great, problem solved, I would just wish ArcGIS Pro was more intuitive. As histogram, I would expect some connection to the data distribution, in reality, it shows simply the class size graphically.
I was able to adjust the Min and Max values of the Raster Stretch Symbology by using the Minimum Maximum Stretch type:

I just wanted to second @MaxMolello's response: Yes, the histogram allows adjusting the minimum value (and I'm glad to know that now!), but it doesn't initially appear to be adjustable there (a problem), and labeling the lowest class range only as "≤ [upper limit]" is inaccurate and misleading (a bug, in my opinion).
I realize now that a map I published where I thought I was showing all valid data was actually omitting some symbols for small values because I'd assumed that "≤ [upper limit]" was exactly what it said it was.
I am stuck trying to do this script. If the range is really small like =.0003 to .00003 it will completely ignore my custom breaks and use a totally made up scale. If the range is medium the breaks take but then the map gets all one color - the min value color. This is totally wrong and users get the wrong idea. In my case I have -100 to 100 for percent's. If the range is -7 to 8 then I get ALL of the map getting the color of -40. These maps are generated in a GP tool on the fly and need them all to have the same symbology.
Totally stuck. Any ideas.
        sym = rasterLayer.symbology
        sym.updateColorizer('RasterClassifyColorizer')
        # was Condition Number
        sym.colorizer.colorRamp = project.listColorRamps('Prediction')[0]
        sym.colorizer.classificationField = "Value"
        sym.colorizer.breakCount = 10
        #sym.colorizer.noDataColor = {'RGB': [255, 255, 255, 100]}

        # manual breaks
        # this will fail on small time periods
        if len(sym.colorizer.classBreaks) == 10:
            sym.colorizer.classBreaks[0].upperBound = -100
            sym.colorizer.classBreaks[0].label = "Over -40%"
            sym.colorizer.classBreaks[1].upperBound = -40
            sym.colorizer.classBreaks[1].label = "-30% to -40%"
            sym.colorizer.classBreaks[2].upperBound = -30
            sym.colorizer.classBreaks[2].label = "-20% to -30%"
            sym.colorizer.classBreaks[3].upperBound = -20
            sym.colorizer.classBreaks[3].label = "-10% to -20%"
            sym.colorizer.classBreaks[4].upperBound = -10
            sym.colorizer.classBreaks[4].label = "0% to -10%"
            sym.colorizer.classBreaks[5].upperBound = 10
            sym.colorizer.classBreaks[5].label = "0% to 10%"
            sym.colorizer.classBreaks[6].upperBound = 20
            sym.colorizer.classBreaks[6].label = "10% to 20%"
            sym.colorizer.classBreaks[7].upperBound = 30
            sym.colorizer.classBreaks[7].label = "20% to 30%"
            sym.colorizer.classBreaks[8].upperBound = 40
            sym.colorizer.classBreaks[8].label = "30% to 40%"
            sym.colorizer.classBreaks[9].upperBound = 100
            sym.colorizer.classBreaks[9].label = "Over 40%"
        else:
            arcpy.AddMessage("Warning Trend Rasters may not work with short time frames. Trying reduced symbols.")
            sym.updateColorizer('RasterStretchColorizer')
            sym.colorizer.colorRamp = project.listColorRamps('Condition Number')[0]
            sym.colorizer.stretchType = "StandardDeviation"
        rasterLayer.name = "Total Change"
        rasterLayer.symbology = sym
If I save out the map I got the correct range but colors are wrong.
Why is it getting blue?


Also really wish we could set an exact range. This upper bound thing is so confusing esp with negative numbers. Plus what I want to leave certain values out? Let me set a upper and lower and call it a day please.
Then if I add a interval in Pro it still lumps -7 to -100 at the top. This seems way wrong right?

thanks
You must be a registered user to add a comment. If you've already registered, sign in. Otherwise, register and sign in.