- Home
- :
- All Communities
- :
- Products
- :
- ArcGIS Pro
- :
- ArcGIS Pro Ideas
- :
- Interactive Gantt Chart (Pro/AGO/Experience Builde...
- Subscribe to RSS Feed
- Mark as New
- Mark as Read
- Bookmark
- Follow this Idea
- Printer Friendly Page
- Mark as New
- Bookmark
- Subscribe
- Mute
- Subscribe to RSS Feed
- Permalink
Any time-based project (think AEC; think emergency preparedness for events/event planning; think indoor/3D...etc) which relies on logistics or seeing data from multiple location (or activity at the same location) uses a Gantt chart view to better understand the data as well as to interact with the data.
Requirements:
- Ability to select Gantt objects and have them highlight in the map and vice versa.
- A time-slider that can manually or play across the Gantt chart
- Chart configuration and use should be the same across all apps: Pro, AGOL, WAB, EB
- « Previous
-
- 1
- 2
- Next »
Our City loses millions of dollars each year due to multiple independent agencies having (unbeknownst to them) project overlap.
Example: A street repaving is completed in July and in August the road is torn up for a new utility line.
It would be nice if our City could host an AGOL web app where each agency drew project boundaries in AGOL that link to a Gantt chart.
@TimothyCallahan @FloraVale a master construction activity/project schedule only gets logistics and planning so far - the hurdle is as you say is to "draw project boundaries...that link to a Gantt chart". This would enable logistic teams or planners/PMs to identify conflicts or opportunities as well as understand task relationships (dependencies) based on time and location, while maintaining a view project durations which provide the overall schedule view.
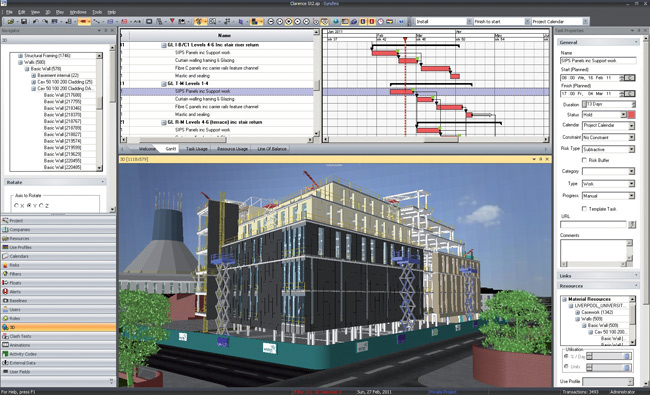
Gantt charts are critical in construction project scheduling and event planning because the planner/PM can visually view the project activities in a way that is logical to planning and managing the project(s) for "what if" scenarios, and to avoid delays and re-work. Microsoft Project, P6, and other PM scheduling software have become more open/exportable for other systems to use.
Adding a geographic link to a Gantt chart is not novel as existing project construction software does this with BIM data for both internal construction and site logistics; scheduling staging and material (or parking, Big rooms, etc.) around a construction site as the structure is being built.
Another scenario: 20 projects are scheduled on a segment of Street A over the course of a 12 months. One project's boundary covers the entire street segment while the other 19 projects are all smaller footprint boundaries but also overlap/cover each other. The time-slider will display all "active" projects as it relates to the time-range defined by the user (1 day, 1 week, etc) on the slider but as a planner/PM I need to see the list of projects, their duration, and how they relate to each other to leverage the geographic view presented to understand conflicts, opportunities, and dependencies. The time slider does not convey to the user that project A is just about to end, and project B has just begun, which a Gantt view would provide.
@MōnoSimeone , @ChristophHaeberli , @DrewFlater , I am late to the party here and as it will be discovered I have not posted before. This idea has brought me out of the woodwork. We are currently in the midst of a full UN conversion. couple that with a new DMS, ADMS deployment, and it's been a fun couple of years. I am writing now because there are several transformative projects happening within our company and I am trying to keep things aligned and useful to our GIS. One thing we are working on is a replacement for our current work scheduler. it is a Gantt chart-based unit that ties to our other work management systems. The current plan is to build this new program in-house. I have sent the internal team working on this project links to ESRI Workforce, and Field Maps but they lack the desired charting ability mentioned in this post. A standalone Ganatt that is tied to a feature layer and could possibly allow for adjustment of times and schedule from either the chart or map would be ideal. Would ESRI be interested in working on something like this?
Thank you for the comment @RichardKoch I took a look and it doesn't appear that you added your kudos to the idea. While comments are important, kudos (the number of votes) that an idea receives is one of the primary pieces of data that we use to determine traction and trends as we monitor idea activity over time.
Please see https://community.esri.com/t5/custom/page/page-id/arcgis-ideas for a high level overview of how ArcGIS Ideas works, and Frequently Asked Questions about ArcGIS Ideas for detailed information.
Thank you for your participation in the community and for helping us prioritize future development efforts for ArcGIS Pro.
Cheers,
Kory
@KoryKramer Thank you. I will look over the links and look forward to more involvement as time permits. If there is anyone at ESRI who would like to discuss this please pass along my contact info and we can also check if @MōnoSimeone would be available since they are the OP.
Regards
Richard.
@RichardKochthe chart person for Esri is @FloraVale though this request is something of a mashup between a chart and the time-slider functionality - at least in my concept of the chart.
What may be helpful to this idea is to explain how you/your teams would use the tool because the first thing Esri does is ask why you can't achieve this functionality with the existing tools. For example, in construction logistics or event planning, in the GIS we want to be able to see how long each activity occurs (this is the gantt bars) to identify conflicts (aka clash detection) and then be able to click on a specific day/time or select a range of time and highlight those records in the map (and to be able to filter by a specific day/time or range). In addition, I need rollups in the Gantt chart to see the subparts of an activity.
One can almost achieve a gantt chart "look" with a bar chart in ExB but it's not a workable solution and falls short of what this request is seeking due to the additional parameters needed to get the expected behavior of a true gantt chart.
Happy to coordinate to push Esri on a solution.
@MōnoSimeone and @FloraVale so we are looking to replace something along the lines of a Click Schedule. ClickSchedule Web Client UI - V8 Documentation (clicksoftware.com).
Now I am not sure if we even use the mapping part of it currently. but in my GIS brain all I see if the idea of a chart that ties to a map with my assets on them since that is really what I am working against.
Our schedulers and "management" types would prefer a Gantt look. I am pushing a more Geo based solution. Found this discussion after talking with one of our internal resources close to the project, and of course the best of both worlds came to me.
SO in its best form the tool would source jobs from our work management software. This software is already tied to our GIS however not all work in it requires origination from the GIS. The work management has the times and dates in it. Scheduler would plan about two weeks out. Full integration would see dates initially set in Work Management and adjusted in the Scheduling phase either in the chart or in the map based on user levels and access. Initial schedule would likely come from the chart.
Benefits of doing this in ESRI....
1 - I could work out planning our own work on the smaller or internal only stuff, and when schedules need to shift see what's near where i was and update accordingly. map and chart working together for better visibility and planning.
2 - Larger State, Federal, DOT type work. I could work out a shared schedule with overlays and triggers so I do not plan work for tomorrow only to find I need to adjust on the fly to some last min change because someone on an opposing team forgot to call or update. Easier to call a few days ahead and say.... "You are still showing incomplete on X, and we cannot move until your part is done"... Can help everyone across the board in keeping a large job on track.
Regards
Richard Koch
I work for the DoD and there is definitely a need for a gantt type of chart for scheduling.
If the gantt chart is interactive with the dashboard, as a person clicks through the gantt chart, changes within the dashboard (maps, media, images, charts etc.) would occur.
Furthermore I could see a benefit within storyboards. Storyboards already have a time-line feature but you have to scroll down to find the date. Why not just go to a gantt-type of timeline that summarizes the storyboard at the top of the storyboard?
The gnatt chart interaction with dashboard/storyboard is sorely needed.
Trying to bump up the post to make this a reality.
There are several use cases for the gantt chart solution to be used to support military users. Operationally, phase lines can be drawn that have a start date and an end date along with logistics information can be analyzed to see if there are any geospatial or temporal overlaps that show inefficiencies. Scheduling maneuvers and training exercise locations to be able to request for certain support at specific times/dates and locations, eg: scheduling FMV assets to cover specific areas and providing both a schedule of flight and geographic location of flight coverage. Personnel calendars with location can be visually provided to security teams/administration support in order to plan trips, provide adequate security and have situational awareness of key personnel.
I'm interested in this option for park ecological restoration. Audience could be external stakeholders (to see expected work areas, specific trees to be removed, active/inactive hunting zones) and internal operations (areas that need herbicide, plans for controlled prairie burns, current location of mobile herds).
You must be a registered user to add a comment. If you've already registered, sign in. Otherwise, register and sign in.