Hi,
I have a tricky request from a client and hope you can help me to puzzle the whole thing out.
There are 2 layers: population density (raster) and polygons with the count of intersections. He needs to get the resulting map with population visualized and popups showing 2 values for any point - density and number of intersections.
For desktop (Pro) I resolved it by creating a combined raster that stores these values as bands.
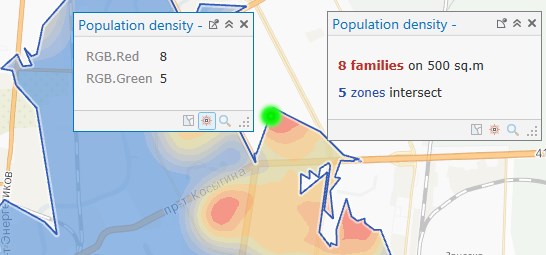
But when I publish it to Portal (or Server) as an Image Service the values are merged.
Is there any way to separate them to get the necessary popup text?
