- Home
- :
- All Communities
- :
- Products
- :
- Mapping and Charting Solutions
- :
- Mapping and Charting Questions
- :
- How can I derive volume from zonal statistics?
- Subscribe to RSS Feed
- Mark Topic as New
- Mark Topic as Read
- Float this Topic for Current User
- Bookmark
- Subscribe
- Mute
- Printer Friendly Page
How can I derive volume from zonal statistics?
- Mark as New
- Bookmark
- Subscribe
- Mute
- Subscribe to RSS Feed
- Permalink
Hello all,
I have several DTMs for which i would like to calculate the change in volume over time. For this I have used the 'CutFill' tool which has generated useful per pixel (2x2m) results in the attribute table. However there is over 13,000 pixels which is far too much data to manage, so I have used a fishnet and then zonal statistics as a table to attempt to calculate volume change per zone. However this hasn't produced a volume as i expected , i only have SUM and MEAN, which I'm unsure of the meaning of?
Is there another way maybe using the attribute table of the 'CutFill' or zonal statistics to condense the data to a more manageable size?
Hope this makes sense.
Thanks!
- Mark as New
- Bookmark
- Subscribe
- Mute
- Subscribe to RSS Feed
- Permalink
Cell statistics would be more amenable to this than zonal statistics since you can track changes by location rather than zones which may be varying in their areal extent.
Have a look... http://pro.arcgis.com/en/pro-app/tool-reference/spatial-analyst/cell-statistics.htm
range would be a good one if your benchmark raster is the first in the list, you can then do an incremental analysis tracking change in depth by area over time.
- Mark as New
- Bookmark
- Subscribe
- Mute
- Subscribe to RSS Feed
- Permalink
Thanks for the reply, not sure cell statistics gives me much different to the zonal statistics as a table (although i may be misinterpreting the output). I was more interested in finding a way to condense data down to a more manageable level from the 'CutFill' analysis table?
- Mark as New
- Bookmark
- Subscribe
- Mute
- Subscribe to RSS Feed
- Permalink
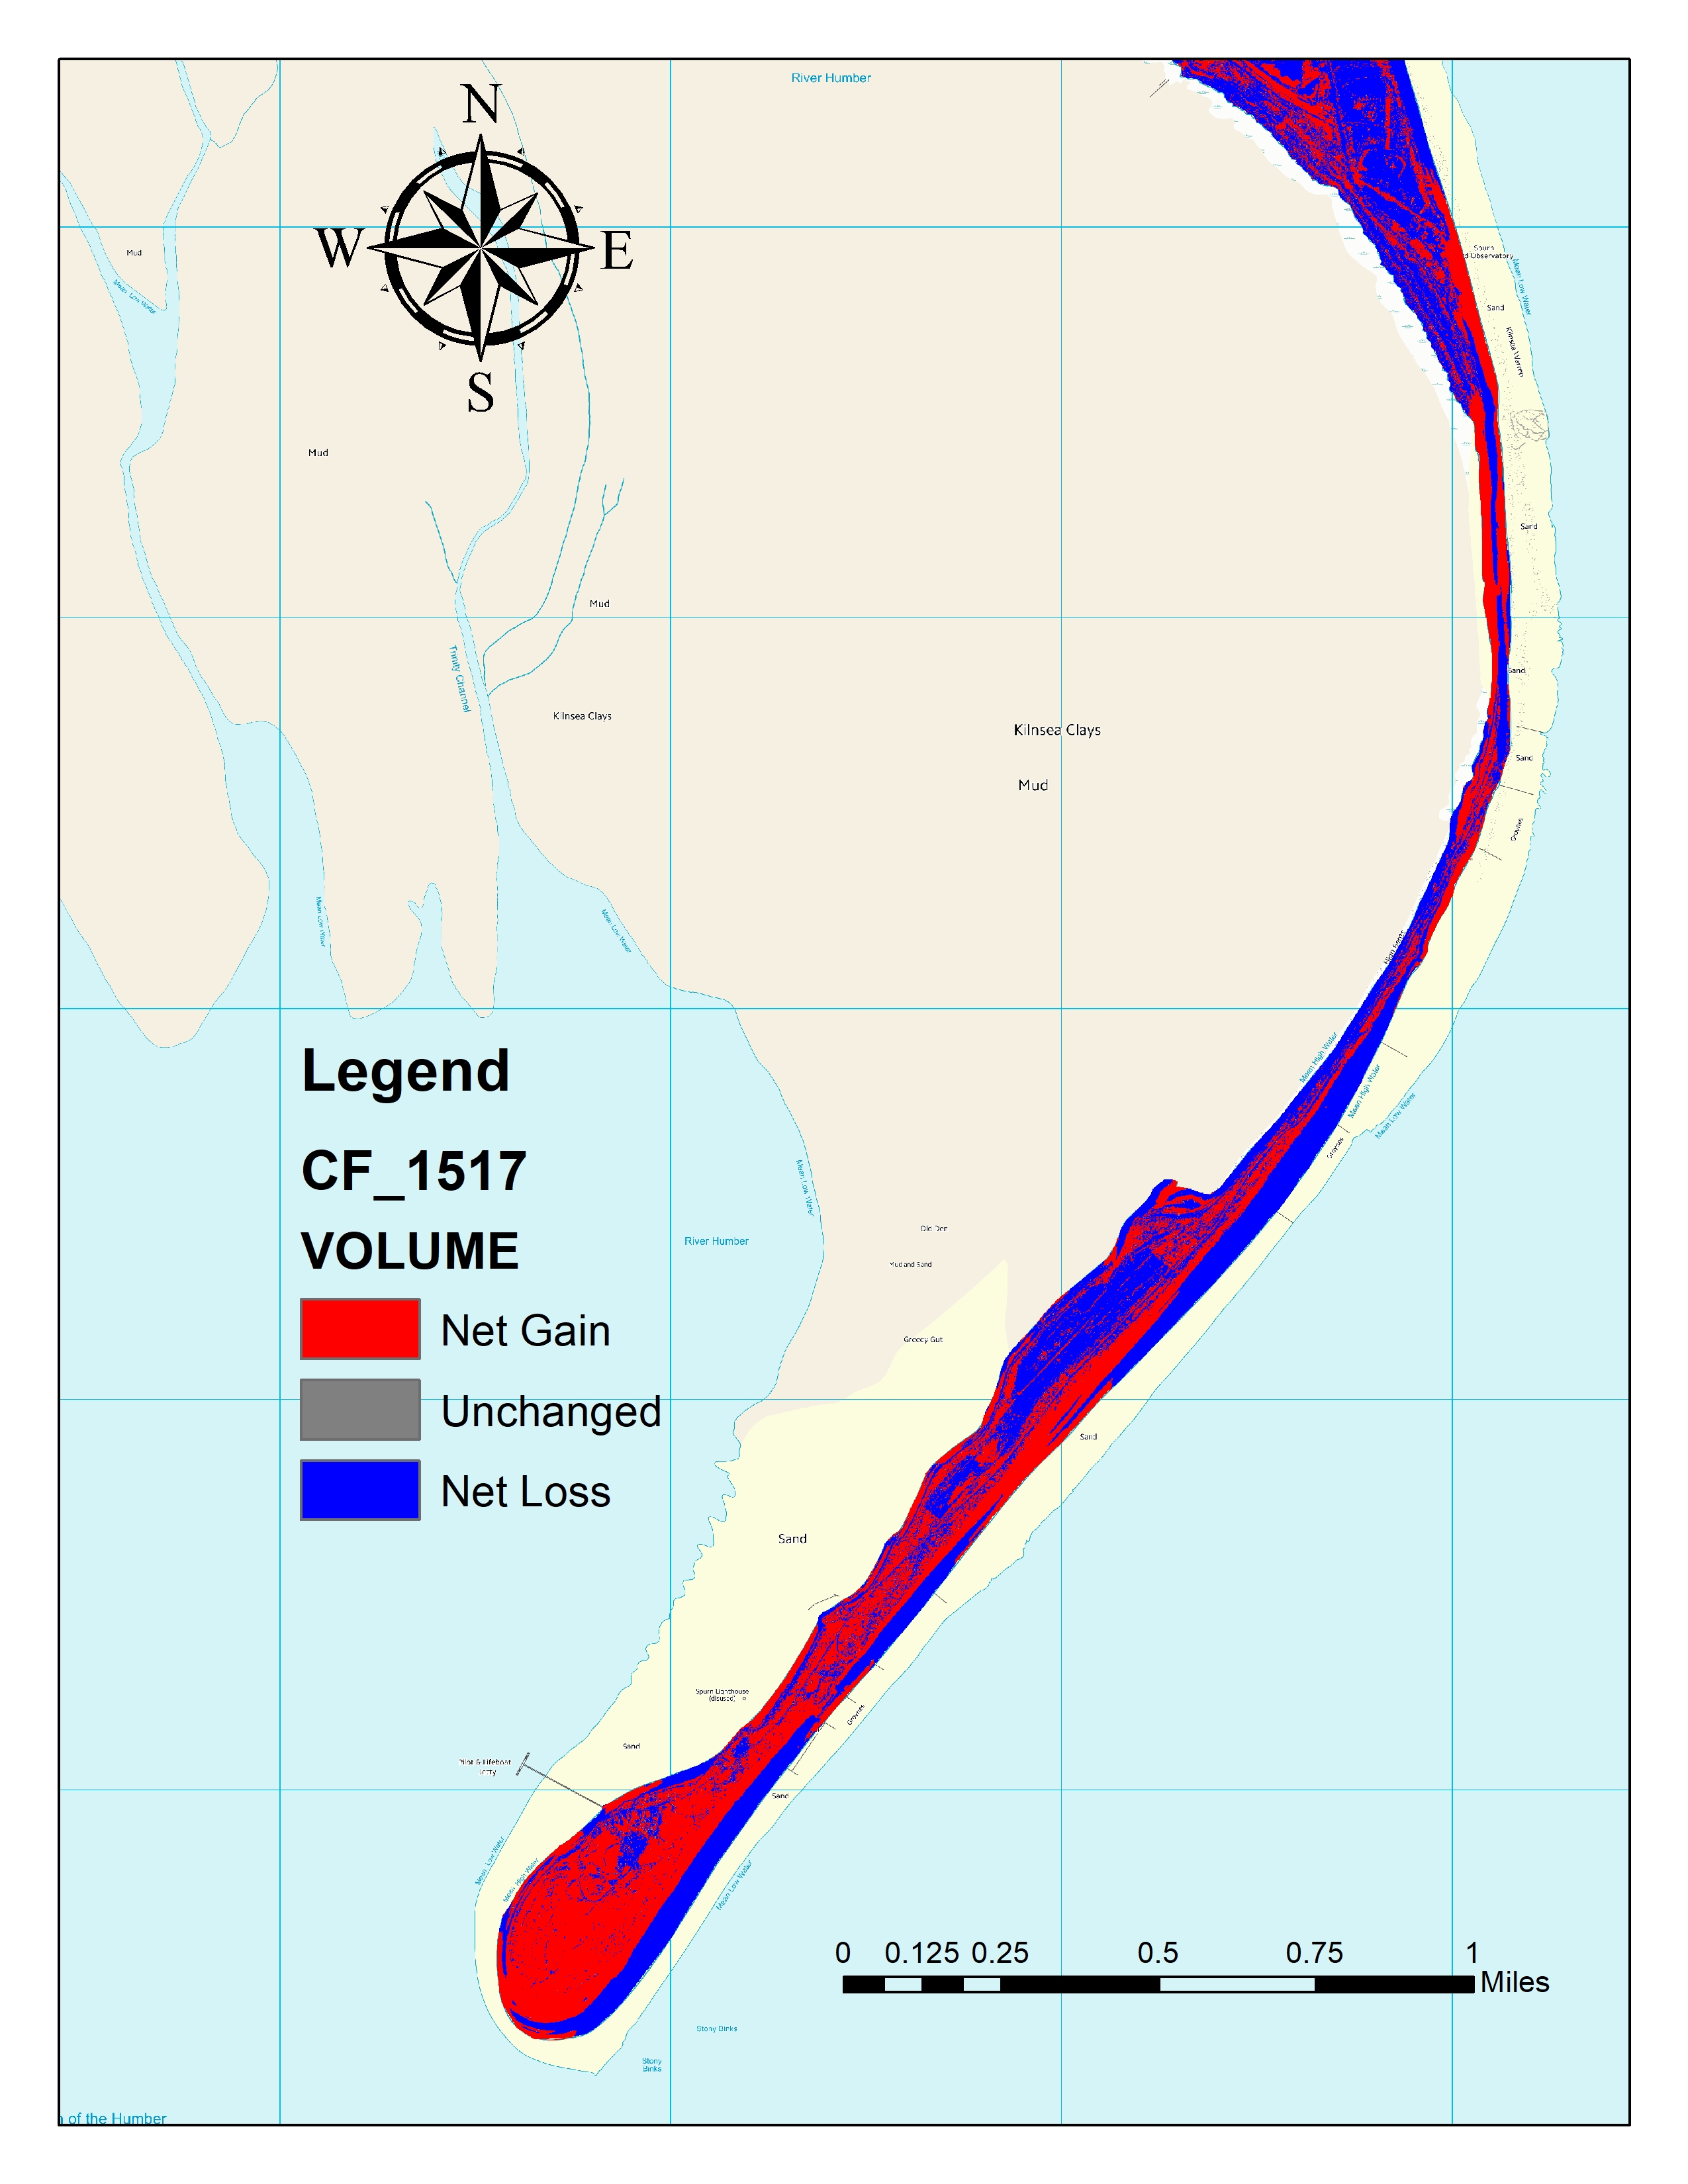
zones summarize on a zone basis. During a cut fill operation your boundaries can/will change which may nullify your efforts. With cell statistics you can examine the process at each time increment. Perhaps an image of your area and why zonal stats doesn't work. I presume you have before/after rasters to permit comparison.
- Mark as New
- Bookmark
- Subscribe
- Mute
- Subscribe to RSS Feed
- Permalink
I have used an analysis mask so the area should theoretically not change regardless? yes i do have a before and after rasters (DTMs). the attribute table will give the VOLUME i.e. the net gain or loss per pixel, so could be -/+ any value. However, after overlaying a fishnet and therefore creating a gridded zone, then using zonal stats you don't get a VOLUME, you get SUM, MEAN, RANGE etc. Hence thee are no negative values, which does not seem correct!
- Mark as New
- Bookmark
- Subscribe
- Mute
- Subscribe to RSS Feed
- Permalink
Ahh Zonal histogram or Tabulate Area
- Mark as New
- Bookmark
- Subscribe
- Mute
- Subscribe to RSS Feed
- Permalink
Shared this to Spatial Analyst
You are more likely to get more traffic there if the above didn't help