- Home
- :
- All Communities
- :
- Products
- :
- ArcGIS Dashboards
- :
- ArcGIS Dashboards Questions
- :
- Heat map style will not update based on date selec...
- Subscribe to RSS Feed
- Mark Topic as New
- Mark Topic as Read
- Float this Topic for Current User
- Bookmark
- Subscribe
- Mute
- Printer Friendly Page
Heat map style will not update based on date selector
- Mark as New
- Bookmark
- Subscribe
- Mute
- Subscribe to RSS Feed
- Permalink
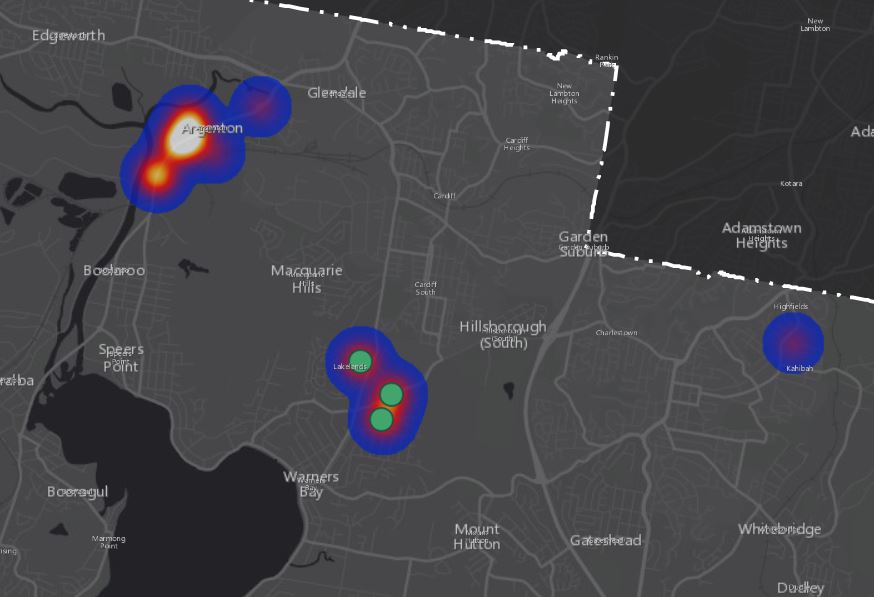
My operations dashboard on ArcGIS online has a map with records shown as both a point and a heat map, when using the date selector with associated action filters the point layer will update however the heat map does not.
Below is a screen shot of web map from the dashboard which shows the heat map layer and the point layer, the heat map is reflecting all records in the layer but the point layer (3 green dots in centre) is filtering correctly via date selector actions. So why doesn't the heat map get regenerated based on the filtered records? The heat map is purely a style setting in the web map not a pre generated static density analysis output. All maps and content are stored on ArcGIS online with appropriate sharing rights. Zooming in/out forcing a refresh does not work.
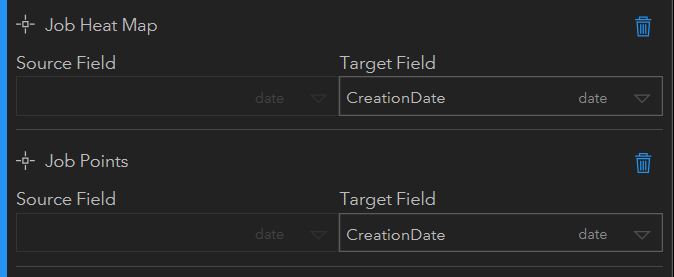
My actions specified in the date selector tool - the 'Job Points layer' updates but the 'Job Heat Map' does not.
I thought a heat map would be popular to show on a dashboard but without the ability to filter records makes it almost useless. Any ideas? I am aware that I can do a 'static' pre set filter in the web map settings but it will not match the dates chosen for the dashboard making it confusing to viewers.
Cheers,
Graeme
Solved! Go to Solution.
- Mark as New
- Bookmark
- Subscribe
- Mute
- Subscribe to RSS Feed
- Permalink
I also have this issue in the new ArcGIS Dashboard release, it extends to any filtering of the heat map symbology whatsoever, not just date based. Every update they make is one step forward, two steps back. Where do I send my invoice?
- Mark as New
- Bookmark
- Subscribe
- Mute
- Subscribe to RSS Feed
- Permalink
I am having the same problem
- Mark as New
- Bookmark
- Subscribe
- Mute
- Subscribe to RSS Feed
- Permalink
I am experiencing the same issue publishing from ArcGIS Pro 2.8 to AGOL.
- Mark as New
- Bookmark
- Subscribe
- Mute
- Subscribe to RSS Feed
- Permalink
I am also having this issue.
- Mark as New
- Bookmark
- Subscribe
- Mute
- Subscribe to RSS Feed
- Permalink
I too am experiencing this issue. Am needing to display a heat map with bar graphs and line graphs on the side that when clicked on, needing the heat map to filter down to the selection.
The map filters if I choose to display my data as individual points, but not when I change the data to be displayed as a heat map. This used to work in the old Operations Dashboards.
Any timelines for a fix for this bug?
- Mark as New
- Bookmark
- Subscribe
- Mute
- Subscribe to RSS Feed
- Permalink
I have the same issue. It's been a while since last post - is this still not fixed?
I am consuming a service from ArcGIS Server 10.7.1 through AGOL ending up in a dashboard unable to filter heat maps.
- Mark as New
- Bookmark
- Subscribe
- Mute
- Subscribe to RSS Feed
- Permalink
Is there any update to this? I'm having the same issue.
- Mark as New
- Bookmark
- Subscribe
- Mute
- Subscribe to RSS Feed
- Permalink
Hey Randy,
ESRI may be able to confirm this, but the communication I received from our ESRI Gold technology provider is that the heatmap symbology is interpreted as a raster symbology--and thus cannot be filtered by any selectors.
I don't anticipate this changing anytime soon. You'll notice that there are similar limitations with heat map symbology in ArcGIS Pro.
- Mark as New
- Bookmark
- Subscribe
- Mute
- Subscribe to RSS Feed
- Permalink
except that it worked in classic dashboards? and that's why we are all here...we were using it before.
Now they are gonna retire the ones that do what we want w/o fixing the new one?
- Mark as New
- Bookmark
- Subscribe
- Mute
- Subscribe to RSS Feed
- Permalink
So, in my testing, this can be done in Experience Builder...so why can't it be done in Dashboards? Based on what @ConnerSchaak says, this is inconsistent...