- Home
- :
- All Communities
- :
- Products
- :
- ArcGIS Business Analyst
- :
- ArcGIS Business Analyst Questions
- :
- Re: Create a series of infographics in html
- Subscribe to RSS Feed
- Mark Topic as New
- Mark Topic as Read
- Float this Topic for Current User
- Bookmark
- Subscribe
- Mute
- Printer Friendly Page
Create a series of infographics in html
- Mark as New
- Bookmark
- Subscribe
- Mute
- Subscribe to RSS Feed
- Permalink
- Report Inappropriate Content
I'd like to create a series of infographics in html format like this one ArcGIS Web Application with a custom template. In arcgis pro business analyst toolbox, I only find the option to export the summary report in pdf or xlsx. In arcmap business analyst, I cannot find the inforgraphic option. In business analyst web, I think I can only export the reports one by one. Is there a way to programmatically do this? Can I create and use a customized template? Will it consume credits? I'm very new to business analyst and infographics. Any help is appreciated!
- Mark as New
- Bookmark
- Subscribe
- Mute
- Subscribe to RSS Feed
- Permalink
- Report Inappropriate Content
Hello Shirley,
I can only answer on a very small thing in your post here regarding Infographic options in ArcGIS Business Analyst Desktop. There is one it is actually a single button toolbar so going to Customize>Toolbars and turning on the Infographics toolbar. It has limited functionality and one needs be logged into ArcGIS Online in the File menu to use.
Regards,
Jason R.
- Mark as New
- Bookmark
- Subscribe
- Mute
- Subscribe to RSS Feed
- Permalink
- Report Inappropriate Content
I've got the same kind of question. I'm working on a demographic analysis by census block group. There's about 150 of them in my county, and I'd like to have links to the demographic in the pop-up for each block group, but I can't find a way to do that in BA.
I tried making a Story Map, which created the infographics automatically. But it also made a map for each block group and put them all into one very long story map.
- Mark as New
- Bookmark
- Subscribe
- Mute
- Subscribe to RSS Feed
- Permalink
- Report Inappropriate Content
Hello Shirley and Josh,
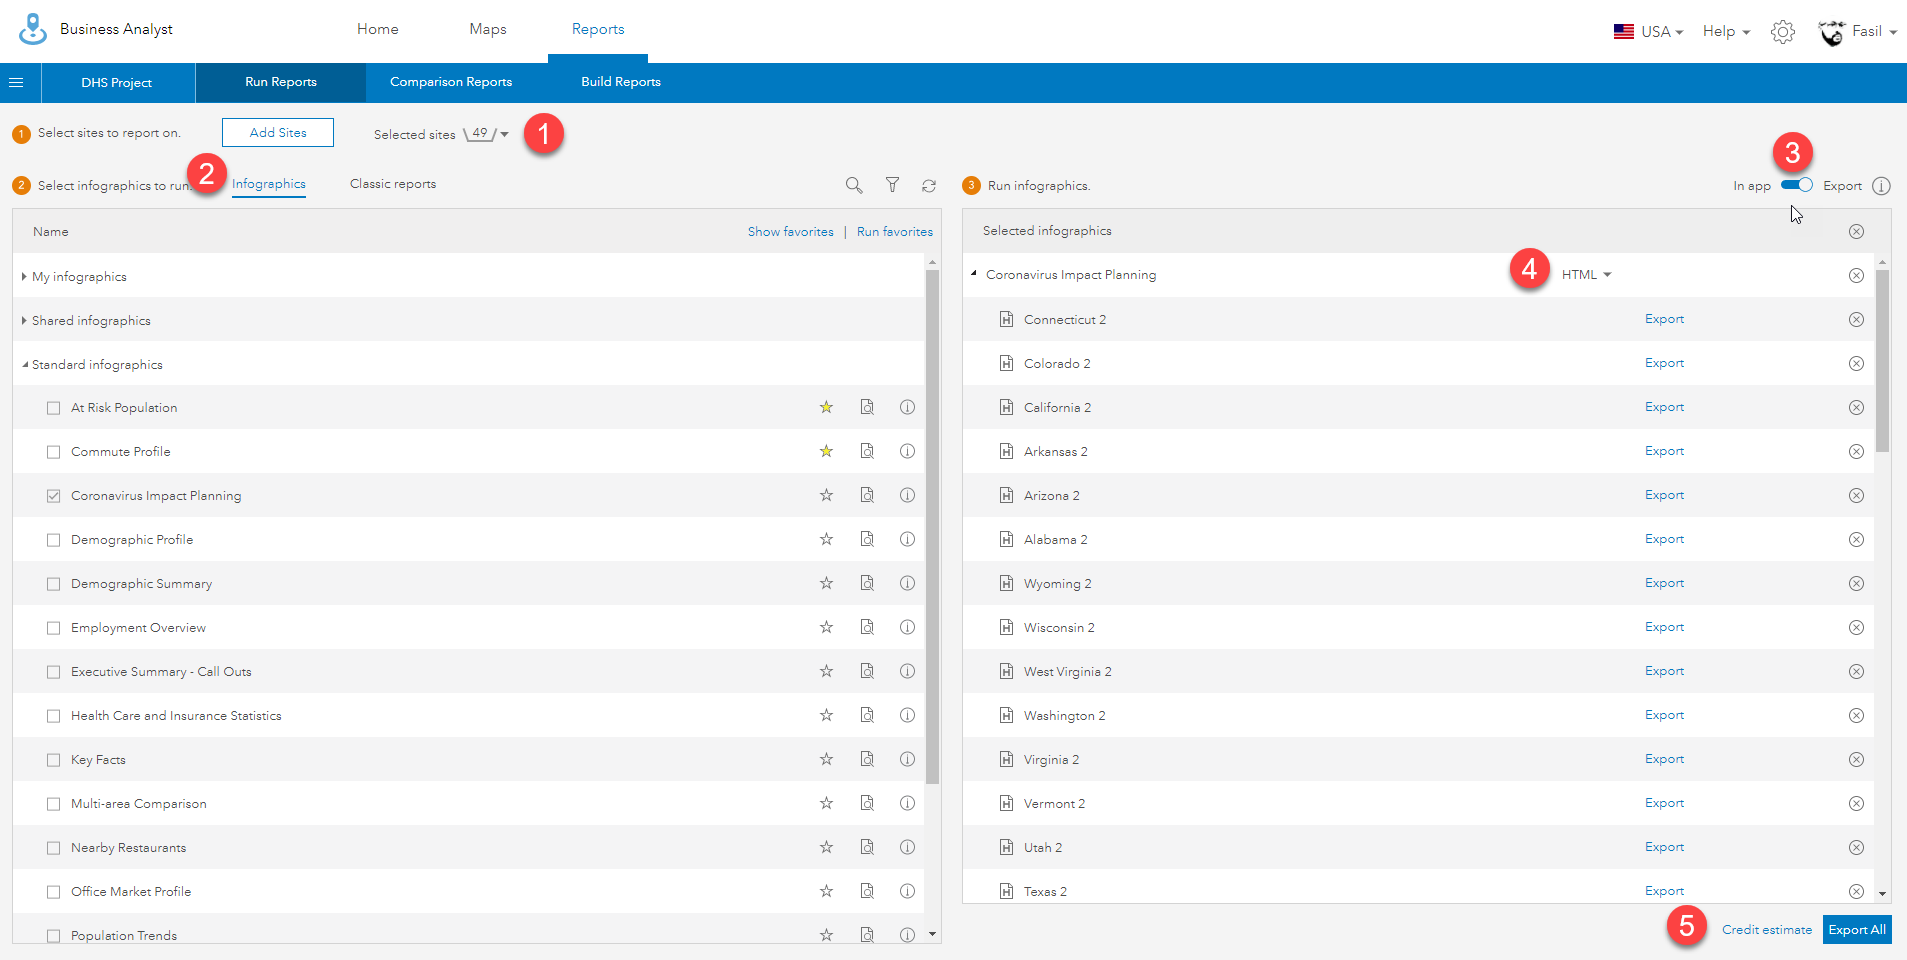
With the recent release of Business Analyst Web App (bao.arcgis.com), you can batch export a maximum of 100 infographics at once to HTML or PDF by going to Run Reports > Run Infographics:

Step 1: Add a maximum of 100 sites
Step 2: Select Infographics
Step 3: Toggle the Export option
Step 4: Select the export format HTML or PDF or both
Step 5: You can click on Credit estimate to see the credits
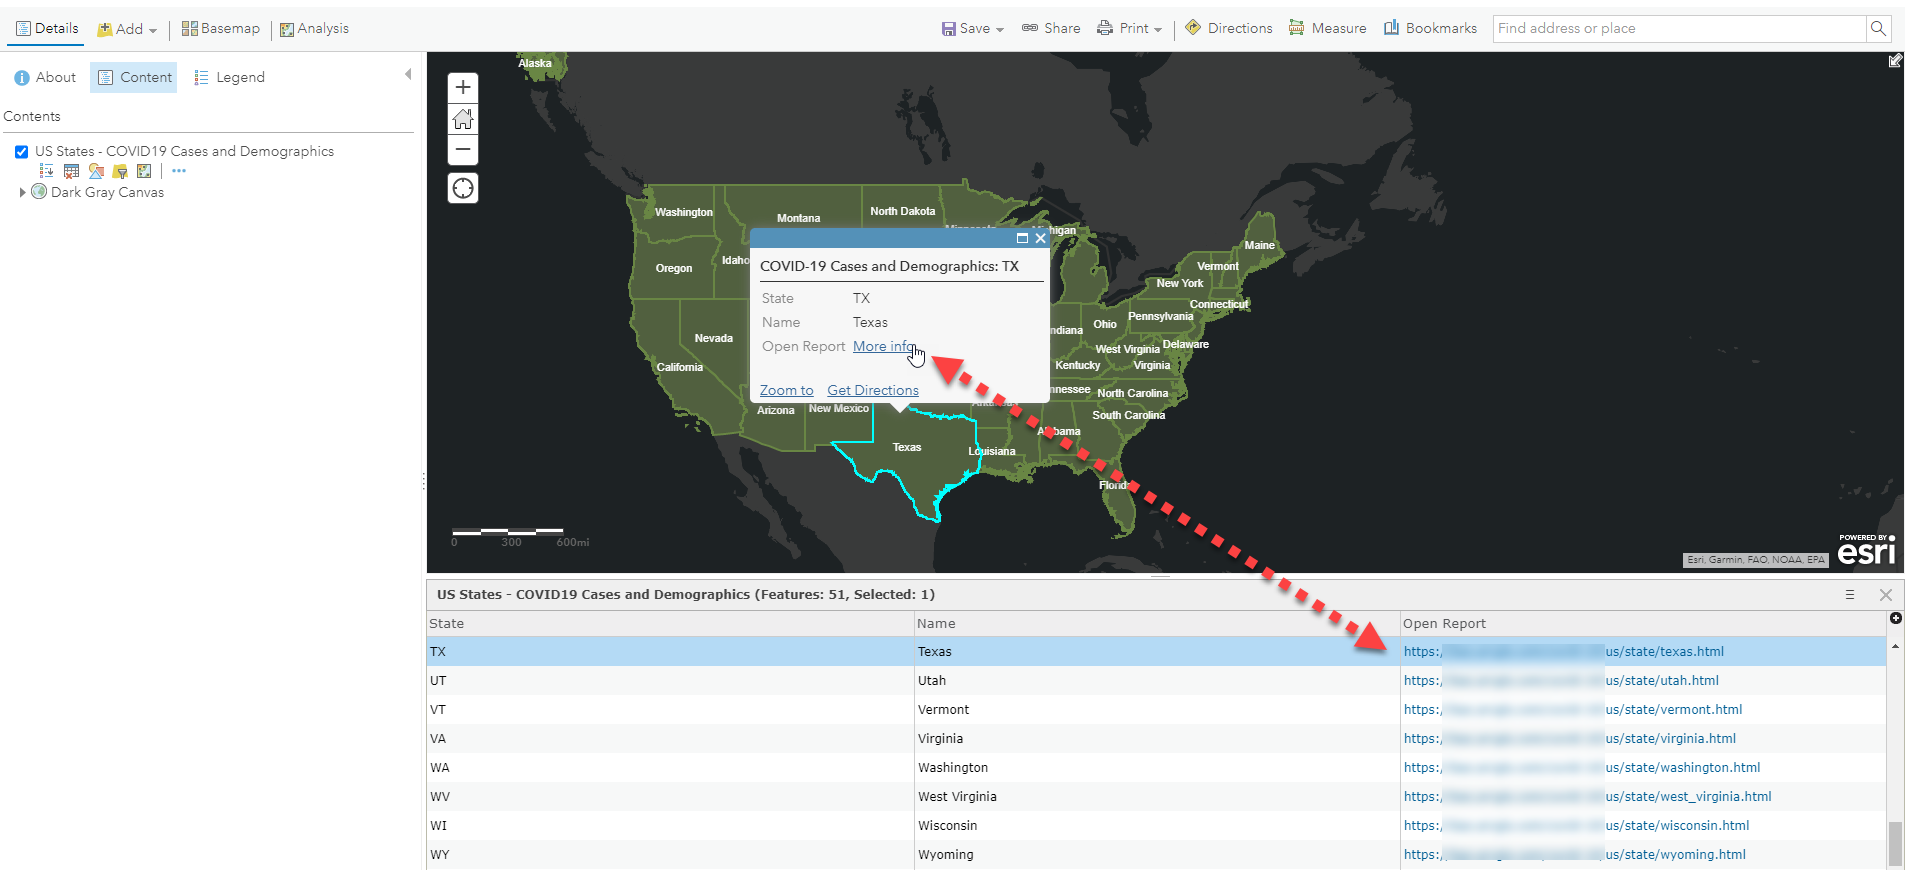
The sample Web AppBuilder app you mentioned above can be created after exporting infographics to HTML and hosting them on your web server. If you have an existing geography layer from ArcGIS Online you used to run these infographics on, you just need to add a new field in that feature service and add the corresponding infographic htmls for each feature. For example, here is a web map that shows the infographics urls for each State:

You can then configure your layer in the web map to show the infographic links for each geography. Then you can take this web map and build a Web AppBuilder or Dashboard app in ArcGIS Online.
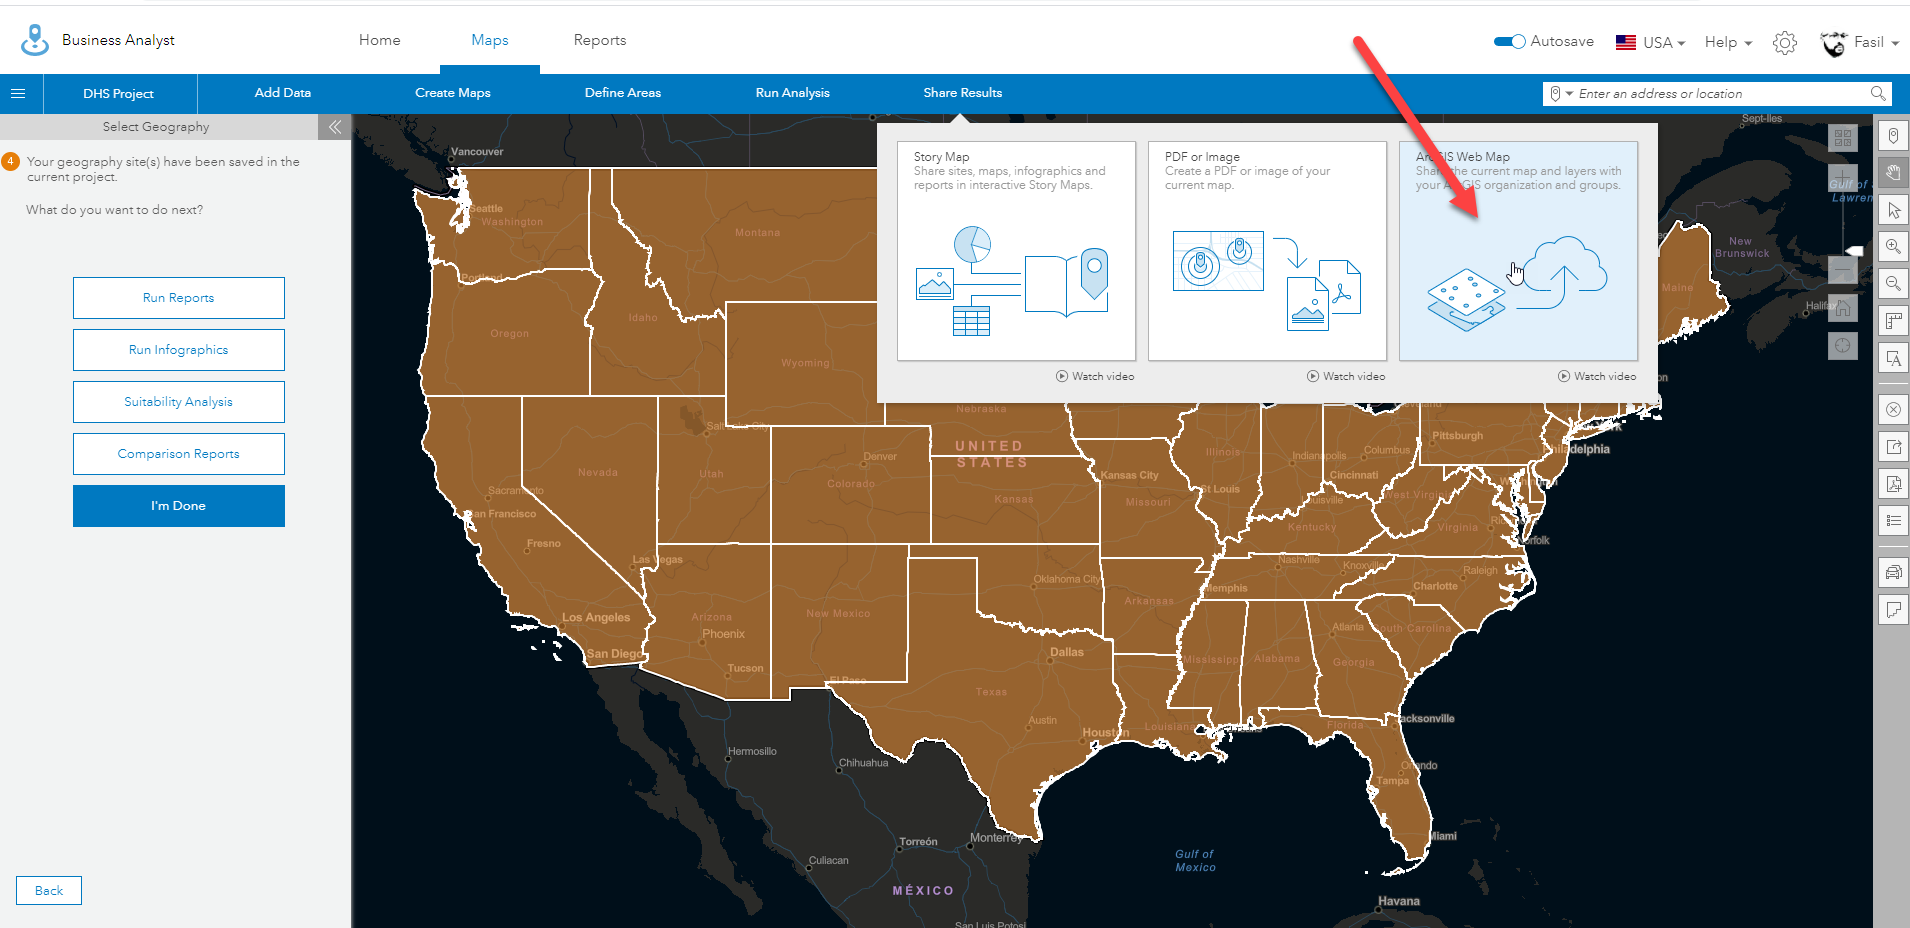
If you don't have an exiting layer, you can share your standard geography layer from BA to ArcGIS using the Share option and then use that layer by accessing it from ArcGIS Online.

However, if you don't have the option to host these exported infographic HTMLs, you can explorer sharing it using story maps as shown in this blog: Sharing ArcGIS Business Analyst Infographics Via Esri Story Maps
Note: there is a 100 site limit in this workflow as well.
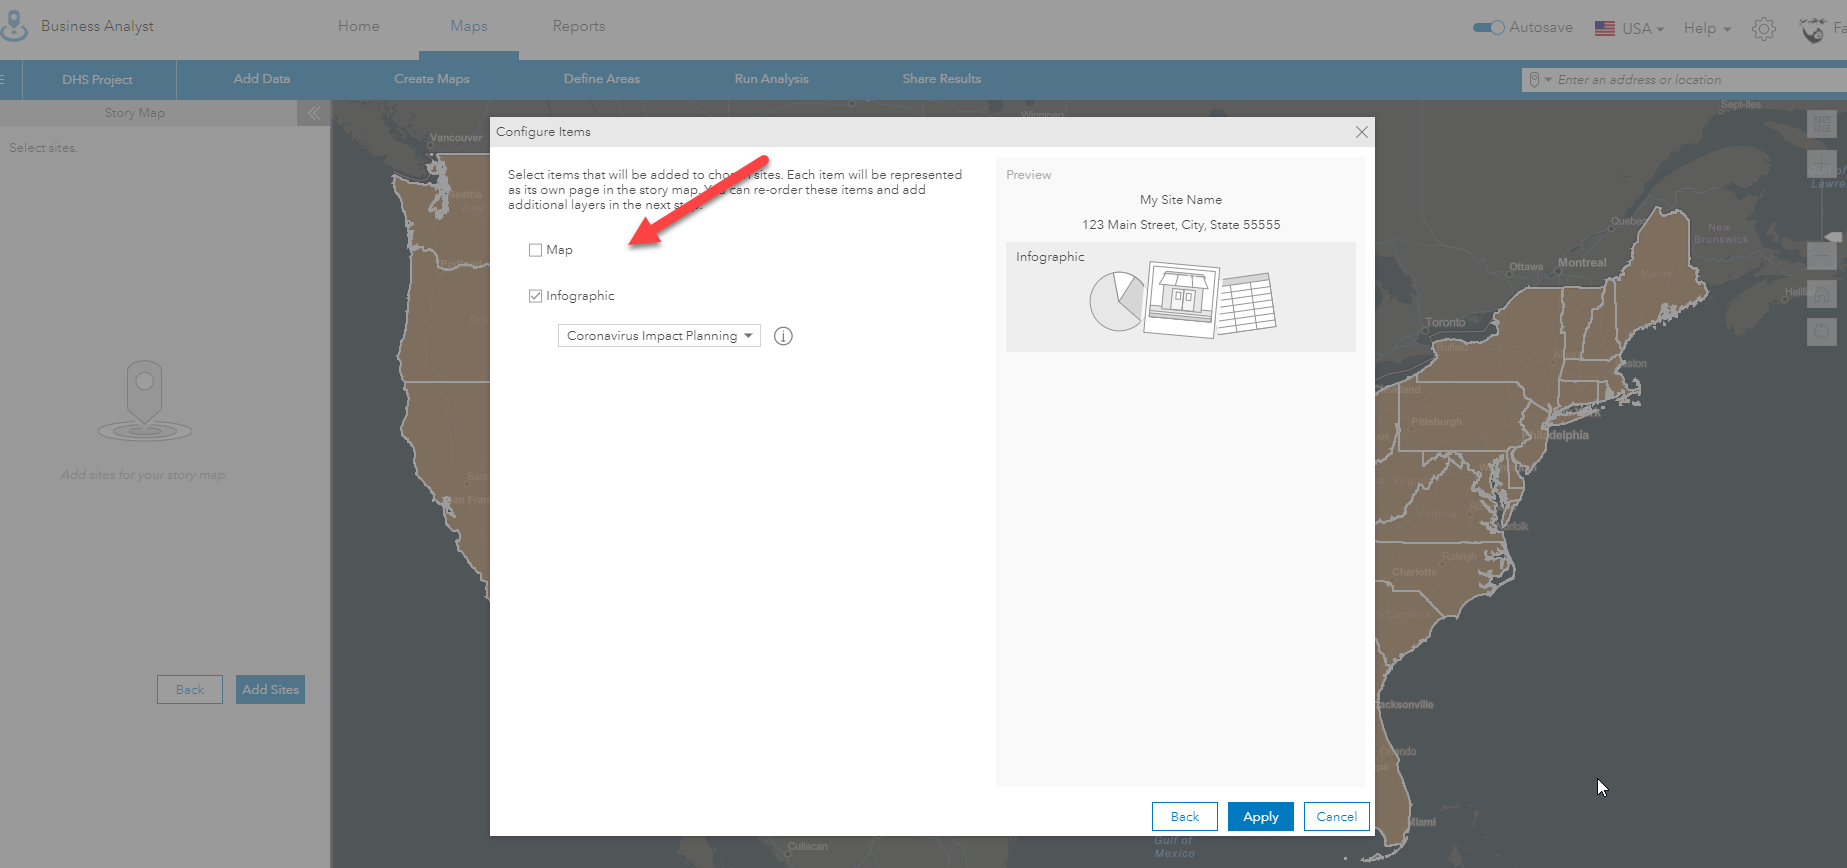
Josh, if you don't want to include the maps in the story map, you can uncheck this option when sharing:

I hope this helps!
Fasil T.
Business Analyst Team