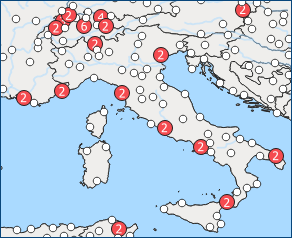
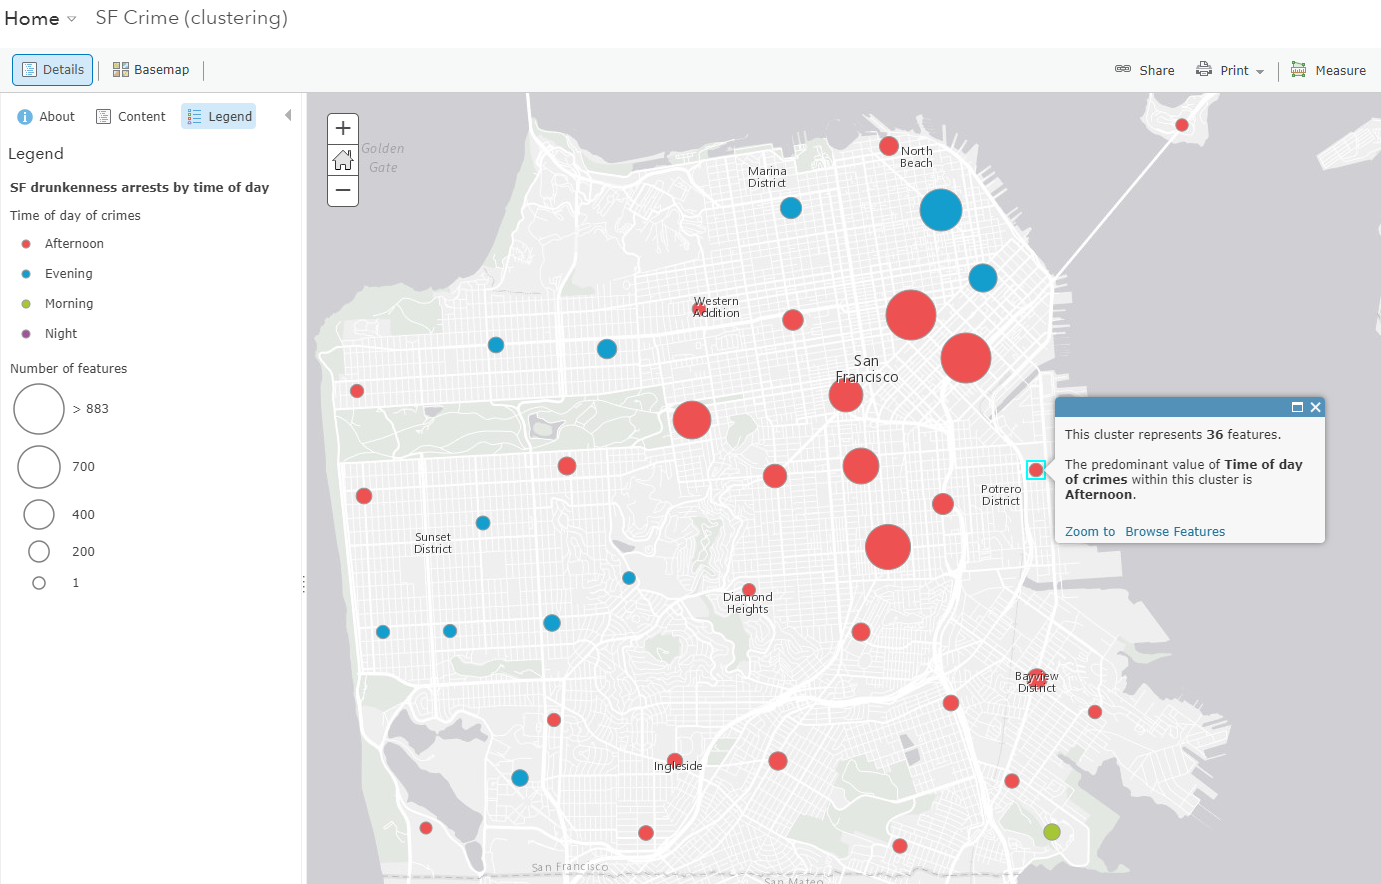
Cluster rendering was demonstrated at the Esri UC Plenary and looks like a great capability. Would like to see this renderer added to the desktop products.
Great thought. Never going to happen. All new development is going to Pro. ArcMap is dying on the vine.
We've marked this as In Product Plan, but note that as John stated, this will be functionality going into ArcGIS Pro.
Is there a time frame for this update? Not having this tool is really frustrating. Would also like to see the symbology in the 'Summary Viewer' web app template made available in online maps or other configurable app templates.
This functionality didn't make it into Pro 2.3 which will be out in January 2019. So hopefully in the release after that.
Thanks for the update. Do you know if they will be bringing this symbology to ArcGIS online? The current 'clustering' symbology doesn't work for most applications and doesn't allow you to add a count label. Would love to see something like the clustering tools in Google maps without having to create a custom application: GitHub - googlemaps/js-marker-clusterer: A marker clustering library for the Google Maps JavaScript API v3.
I got Pro 2.4.1 but can't see it anywhere.
Hi Kory Kramer, will it make it to 2.5? Will Multipoint FC be supported?
#point cluster
#dispersed points
#multipoint features
Hi Kory,
Thanks for your reply. My multipoints are planned actions on e.g. railway stations (bicycle parking, park&ride, platform extension... with different priorities, so it's a symbology based on 2 fields), the same action plan can affect 2 different railway stations, therefore it was decided to use multipoint fc. There might be about 4-5 points at the same or very nearby location, and I would like to put the points on my (print) map so they do not overlap. I didn't find a solution with representations or symbology offset (not always the same type of points are clustered together and sometimes there are 2 with the same symbology) and I don't want to change the geometry of my features. I imagine something like the labelling offset with leader lines to the actual point.
I stumbled upon this post and was wondering if this could be a solution... I do not necessarily need to display the cluster information.
Cheers
I'm having a tough time understanding the logic behind a point clustering feature not included in an advanced application such as desktop Arcgis pro. This feature would be really helpful for some of my multi point maps projects. Open source QGIS has this functionality and it works quite decently. For the amount of money organizations pay for ersi licences, you'd think they'd cover this base. Sorry, perhaps this is harsh, but it's frustrating not to see it.
QGIS (Point clustering)
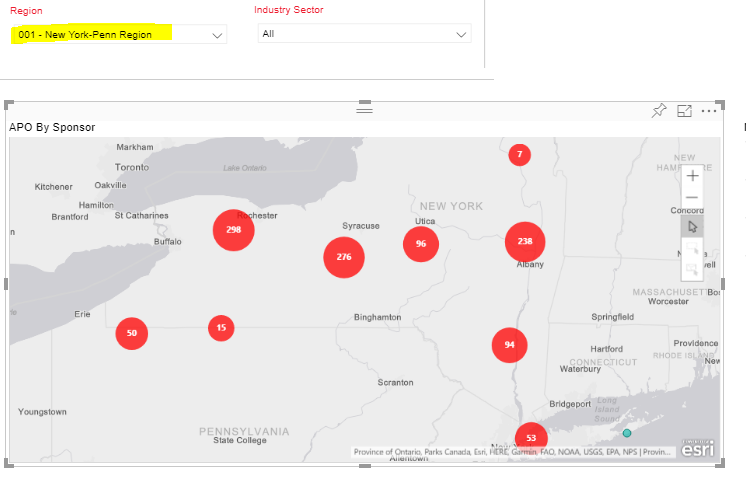
Seems like point cluster functionality is scattered around other esri platforms/plugins (mostly dynamic tools) but not necessary as requested in this post for desktop. Esri's plugin for Powerbi has it, but that's just a limited plugin and not an option in pro. ArcGIS Online has it, but not with a number label. Rather just a larger bubble with the number shown upon rollover. Not bad, but not as good as what is out there. Plus, this is a desktop request.
ESRI map plugin - PowerBI (point clustering)
Arcgis online - (point clustering on rollover)
Would love to see this feature. Not sure I really understand the delay, as Pro seems to almost exclusively focussed towards displaying data (at the expense of creating it) We have global point feature classes showing thousands of data points and something like this a great way of giving the impression of data spread globally and still allowing users to view individual data points at a more local scale
Kory Kramer any news on this? Seems like something that should already be implemented for Pro.
Thanks Kory for directing me here. I would think that the best implementation of this feature would have custom color coding. I'm new to all this but, I thought Pro was the most advanced GIS package on the market?
Further to my comment last Feb I now notice that ArcGIS Pro has forced a "Display Limit Notification" warning message on us for AGOL data that exceeds an (as far as I can see unspecified) number of features. This message wasn't there in 2.6.
I am more than happy to use scale dependencies to get round this for lines and polygons, but once again the logicial way to get around it for point data all of a similar type is clustering.
Our customers will now get that annoying window every time they load one of our global point datasets. Please don't force this warning message/limit on us, without giving us the logical tools to prevent it!
@KoryKramer Any news on this? I'm very surprised to not have this functionality in Pro yet (2.7.0).
My use case: I have a point feature class that represents clients of our company, that were geocoded using zip code centroids. When displaying these points on a state-wide map, many of the points are too close together to display and label with a client number. I can create an inset map, but our marketing department would prefer I make a single large point for a metropolitan area and tie multiple client number labels to the single big point. I figure I will still need annotation for this, as point clustering typically has a single label representing the number of features being clustered together.
@JoeBryant1
We are actively working on supporting clustering in ArcGIS Pro and are hoping to release this sometime later this year or early next.
Having said that, if you’re working with an enterprise geodatabase, please look at Feature Binning which is another way to make meaningful maps out of overlapping points. This is not a replacement for clusters but might help users on this thread so we wanted to mention it.
Hope this helps!
Thanks
We just upgraded to 2.7. What a disappointment that this is still not a default functionality. Leaflet library and analog OS tools offer this since 10 years and here we have a battle on such a basic function on an expensive solution.
@Geo_Supp
We are currently working supporting clustering in ArcGIS Pro. It is too early to put a release number on that. But hoping to bring this capability to our user community by the end of this year or the next.
We'd really appreciate if you could share your use case.
As I mentioned in my previous comment, please take a look at Feature Binning capability and see if that helps you in the meantime.
@TanuHoque thanks, we are aware of feature bining. We re not looking for alternatives, we need this at some time.
Would you mind share your use case? We'd appreciate this.
thanks
@TanuHoque Well it's nothing more than the obvious usercase: we d'like to display quite large and partly densly populated point Datasets (heteregenous). This ist partly possible with heatmaps for some far out zoomscales but when zooming in, a quantitative view is required, hence the count of certain points aggregated by category. Otherwise the map is completely overcharged and unreadable. Hexagon bins is not really the ideal replacement, but could be the best for now in our case. Disperse of symbols/labels ist not an option as is does not solve the overcrowded issue, it's just an offset. Plus further geoprocessing in between input and map is not really wished before displaying the points as this becomes quiet complicated. The whole thing has to work with Pro 2.7 and ArcGIS Enterprise Portal 10.7, so technological compatibility between server side, data and GIS desktop is key.
Thanks @Geo_Supp I hope you won't mind for two follow up questions.
a quantitative view is required, hence the count of certain points aggregated by category....
Are you suggesting that points should be cluster not just based on their spatial proximity but also by categories? Let's say there are 4 points very close to each other and they should be clustered to a single cluster-point based on a given cluster-radius. Now, say two of them belongs to CategoryA and the other two to CategoryB. Do you want two cluster points (one for each category) instead of one cluster point?
The whole thing has to work with Pro 2.7 and ArcGIS Enterprise Portal 10.7
Do you want to share that as a map image layer aka map service and want to change cluster related properties of the map image layer using web clients? or you want to share out and consume that as a feature layer on your web apps?
I really appreciate all your feedback. This helps us tremendously.
@TanuHoque really it is hard to answer on the dry without being able to try. Basically any clustering would be an advantage for a start. Then yes clustering with category discrimination would be nice, so optionaly chosing a unique value discrimination field so that for a location it shows that on this point/radius there is 5 Cat A Points and 7 Cat B. But I guess this could also be achieved by duplicating layers and changing the query, as far as cluster results layers do not overlap with each other.
About the format of the sharing, unsure what the advantage and cons of each would be. I guess both could be fine, whatever is more performant or easy. In our case the Input points would probably be in a csv or other table and previously be pre-processed(or not) in FME. Loading/displaying the csv (changing daily) directly in Portal would certainly be a nice shortcut too, the productive workflow ist not finished in this case.
Thanks @Geo_Supp for your feedback 🙂
This is implemented in ArcGIS Pro 2.9. See Ideas in ArcGIS Pro 2.9 or go directly to 6:44 in the video.
Thanks for the update @KoryKramer, this is a good improvement, will test the implications
(just updated to 2.9.2)
Tested it, actually not very well implemented:
Meld je aan om te posten, content te volgen en meer. Nieuw hier? Registreer gratis.