I have a standalone file geodatabase table called Projects. I've created a bar chart from the table.
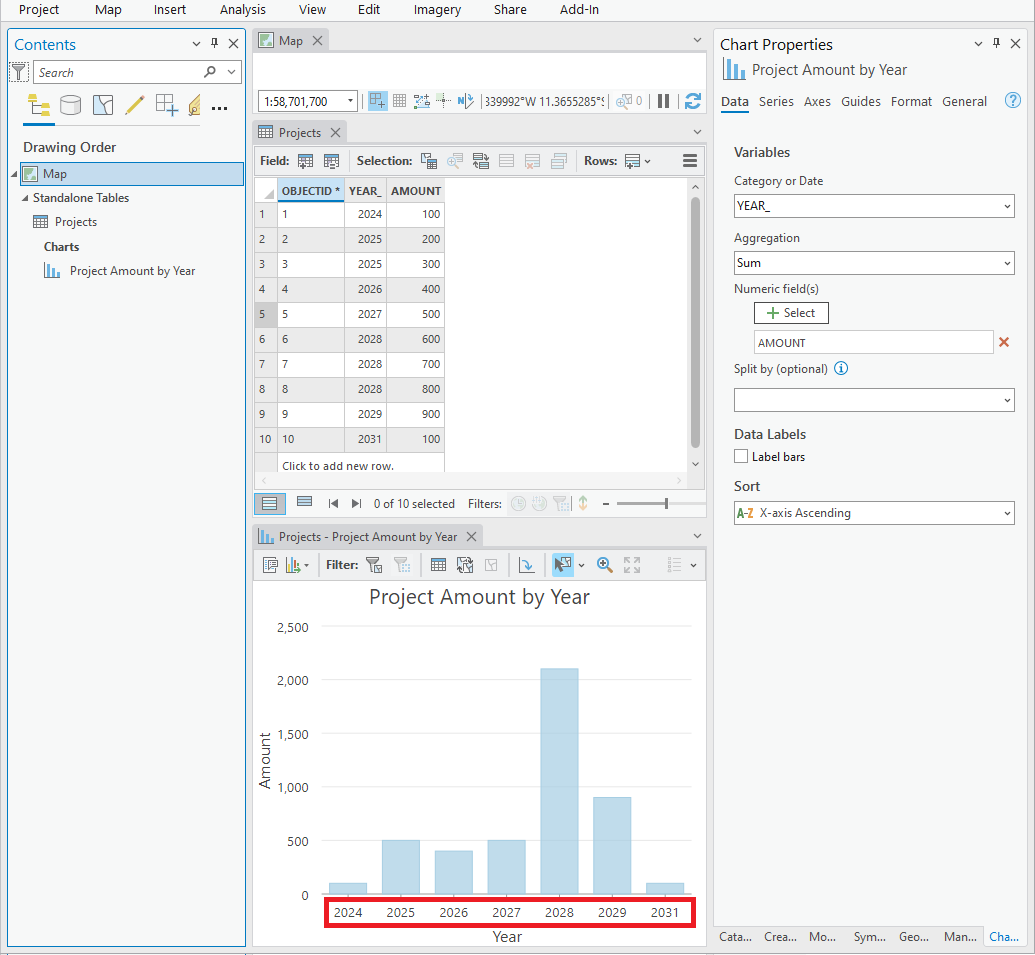
That works, but I need bars in the bar chart for each year within a range: system year + 9.
In other words, I want bars for 10 years, starting with the current year (currently 2023).
So I need to force ArcGIS Pro to show empty bars for 2023, 2030, and 2032.
It would look like this:
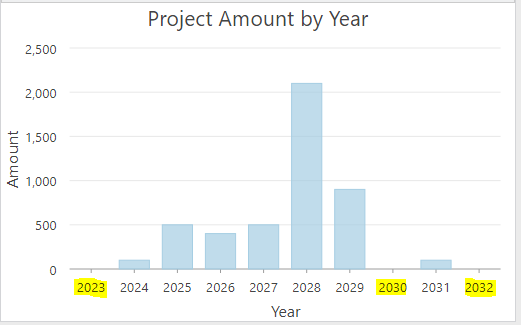
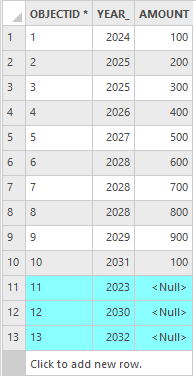
I mocked that up by manually adding filler rows to the table (not the desired solution):
Question:
Is there a way to dynamically force the bar chart to show the missing years? (10-year range: system year + 9)
Thanks.
ArcGIS Pro 3.0.3