Hello everyone,
I’m working on a capital project dashboard and I’m trying to find out whether or not we’re able to duplicate this project status icon, like the one shown on Charlotte (NC)’s CIP dashboard. I know we can add different statistical charts/graphs to dashboards but I am unsure how to add one for each project.
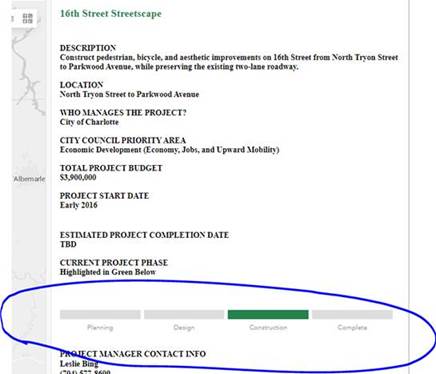
Any help is greatly appreciated. Thanks in advance!



