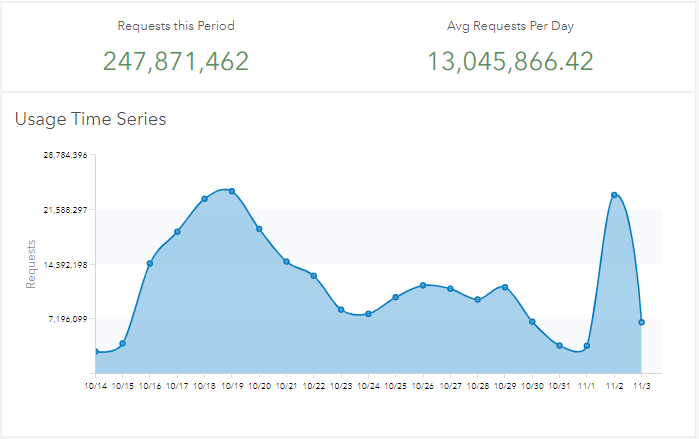
Now that the election is "over", I'm trying to understand the usage statistics for our election Wait Time app (which was a big success). When I look at the Usage Chart, the dates seem odd. Usage appears to peak on Monday 11/2, the day BEFORE the election, when the polls were not even open. This doesn't seem right. I've attached a screen shot showing the usage chart for the hosted AGOL layer that supports our app. Can anyone explain why the usage stats seem to be off by a day? Am I reading the chart wrong? Peter Klingman
Thanks,
Jay


