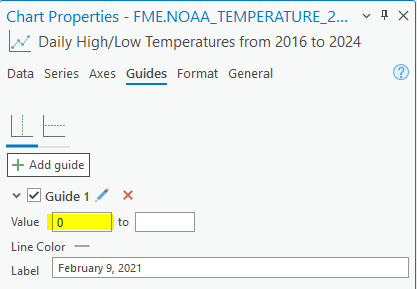
I have a line chart in my map depicting temperature values over time and so the X axis is a date attribute. I want to add vertical guides to this chart but can not determine the proper format of the guide value when my X axis is a date. I have not been able to find this answer on the web.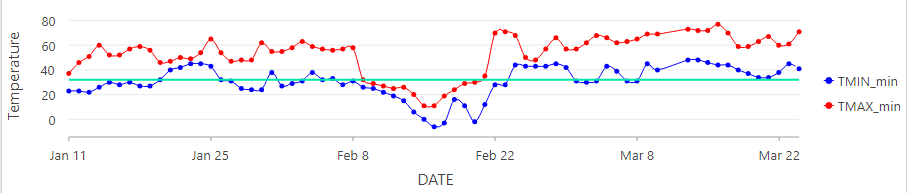
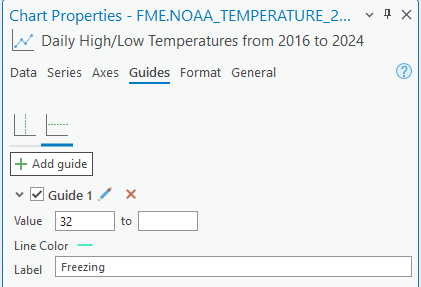
In my example I have a horizontal guide at 32 degrees and so the guide value is 32.
But I also want a vertical guide on February 9th, 2021. Since the X axis is a date field, what would the guide value format look like in order to achieve that?