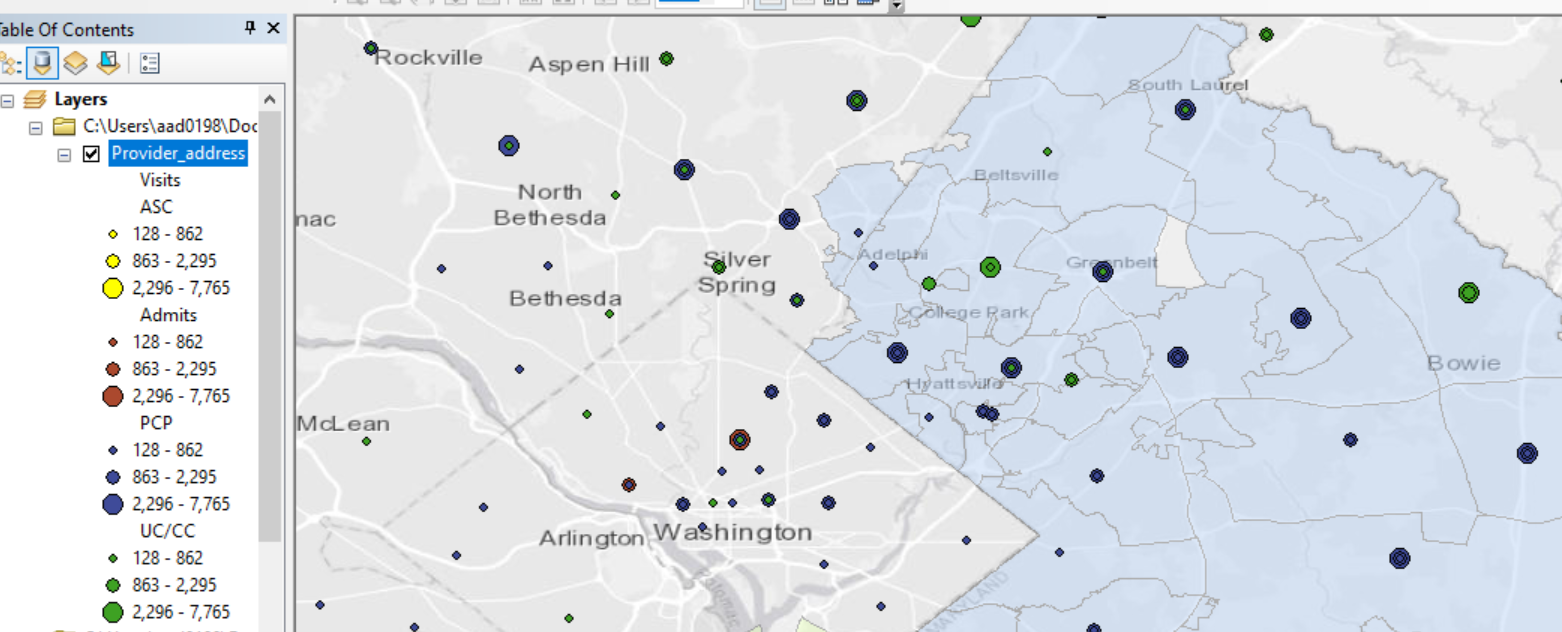
Hello: I am trying to plot four categories of health care providers, using X/Y coordinates for address. Several provider addresses have the same X/Y coordinates, and are therefore overlapping. However, for some reason, the "ASC" category (shown in yellow in the screenshot below) are not displaying at all. When I remove the other three categories from the layer, the "ASC" category is displayed.
Would appreciate any suggestions for formatting, etc. I have tried changing the shape for this category and slightly increasing the offset for the "ASC" category, but that conflicts with the business requirements for this project.
Thank you!