Does anyone know of a workaround or solution to how I could create this type of map on AGOL with bar (column) chart symbology, so that I can add it to an ArcGIS Dashboard?:
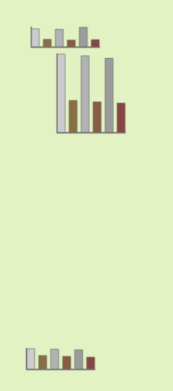
I know I could just create some individual bar charts in Dashboards, but I really want to show these charts according to their locations.
I am working with a feature class that is in my local .gdb . I am displaying 6 fields in the bar charts.





