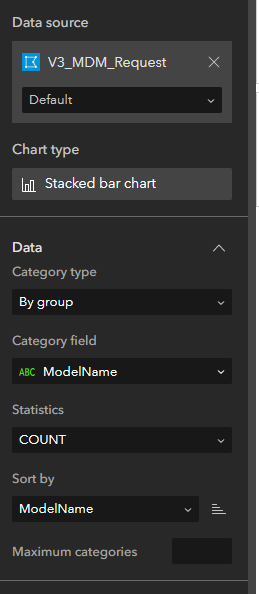
I am new to Experience Builder and trying to create a stacked chart, but I do not see an option to select a second attribute to split by. I am using it in ArcGIS online. Can someone point me in the right direction. I also see that there is the option to see counts when you hover over a column, but don't see where to turn that one. Many thanks!