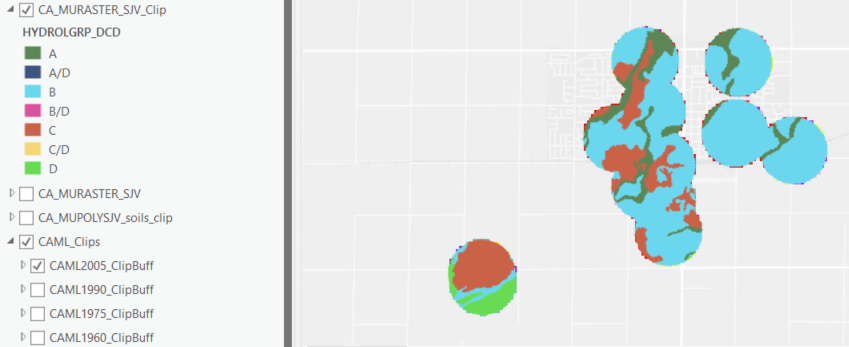
I have a soil classification raster that I clipped to a 500m radius circle around central contamination points. I am trying to determine the majority soil type (hydrologic group) in the clipped rasters using the Zonal statistics as table tool but I must be doing something wrong?
I have done this successfully with another raster but there was only one value in the attribute table to calculate the majority within the clip, here there are a more than one column in the attribute table.
For example in the picture - visually most of the buffer zones seem to have a majority blue by area (soil type  but I would like ESRI to calculate the majority area for each circle for me...