Hello all,
I am creating a dashboard with a web map that pulls it's data from a REST service. I do not have privileges to edit this REST service in any way, hence the need for an Arcade workaround to my problem. This means I cannot create, edit or delete any fields for this data. I have also only been coding for about a week and a half so my skills are quite narrow in scope.
With that being said. . .
The purpose of the dashboard is to show various sums of farmer's and roadside markets for my state. For one of these sums in question I want to display the sum of markets open throughout the year based on 3 categories:
- The sum of markets open year-round
- The sum of markets open between 6 - 11 months in the year
- The sum of markets open less than 6 months in the year
Each one of these pieces of data would be represented by one slice on the pie chart to create a total of 3 slices. My dashboard has a selector that filters the data displayed on the dashboard depending on if you have just farmer's markets or roadside markets selected, or both. I would like this pie chart to reflect it's data accordingly. This shouldn't be too hard as there is a field dedicated to describing each market as a farmer's market or a roadside market. I probably can just filter the completed pie chart the same way as the other dashboard elements inside the action tab of the selector.
My inability to create such a chart stems from this:
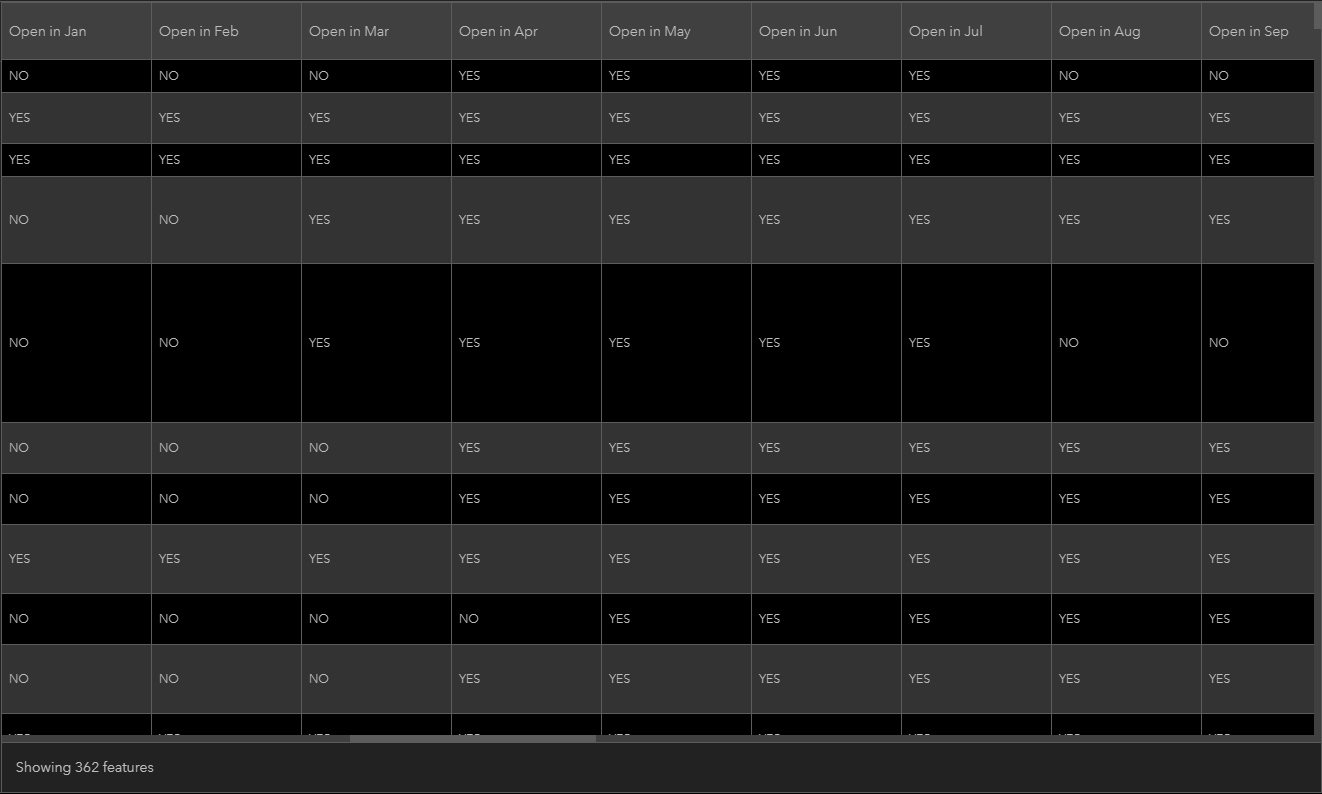
The data for what month(s) a market is open is organized by 'YES' and 'NO' entries in 12 separate fields for 12 months of the year for all 362 markets. The data is updated by myriads of moderately independent local groups across my state so a foolproof method of inputting data is necessary to preserve schema.
I not only am pretty lost on what function(s) to use to categorically sum the data with the 3 criteria I listed before but also wouldn't know how to begin that expression since all of the functions I have tried can't seem to use non-numerical values as indicators. (i.e. using "YES" as criteria for a sum or count function, or something similar) At least, that's what I am picking up from trial and error. You also lose global variables functionality when using the dashboards expression editor profile which has made this much more challenging for me as my only experience with Arcade expression editing has come from editing pop-ups. I am able to use the featuresetbyportalID function to grab the data as well as just the fields I need, but I don't know where to go from there.
I found this post to be somewhat similar in scope to mine but OP realized exactly the one solution I have no option of implementing which was to create a new field for his calculation. @AdrianWelsh mentioned in a reply to that post something about exploring a different workaround than creating a new field by using Arcade expressions and this seems to be exactly what I am looking to do- just without using numerical data entries.
Best regards to anyone concerned,
-James


