I am using tabulate area in Spatial Analyst Tools to calculate the percentage of different land types in each CONUS state. But the final results does not make sense. For example the percent "CULTIVATED CROPS" land types are much lower than expected and even the ranks do not make sense!! For example highest cultivated crops is over 26% for Florida! While Iowa is number 29 with only 1.27% crops land, or Nebraska 36 with 0.77%!!
I simply added all land type values from Tabulate Areas and then divided CROPS_LAND by total!
So here is the process:
I'm using ArcGIS Pro 2.7.0 .
* Feature zone is a vector layer containing state boundaries of CONUS from TIGER/Line Shapefiles of Census Bureau
* The raster layer is the National LandCover Database (NLCD 2016) which is an .img file with 30mx30m land types over CONUS. (over 1 GB file size)
here is a picture of them
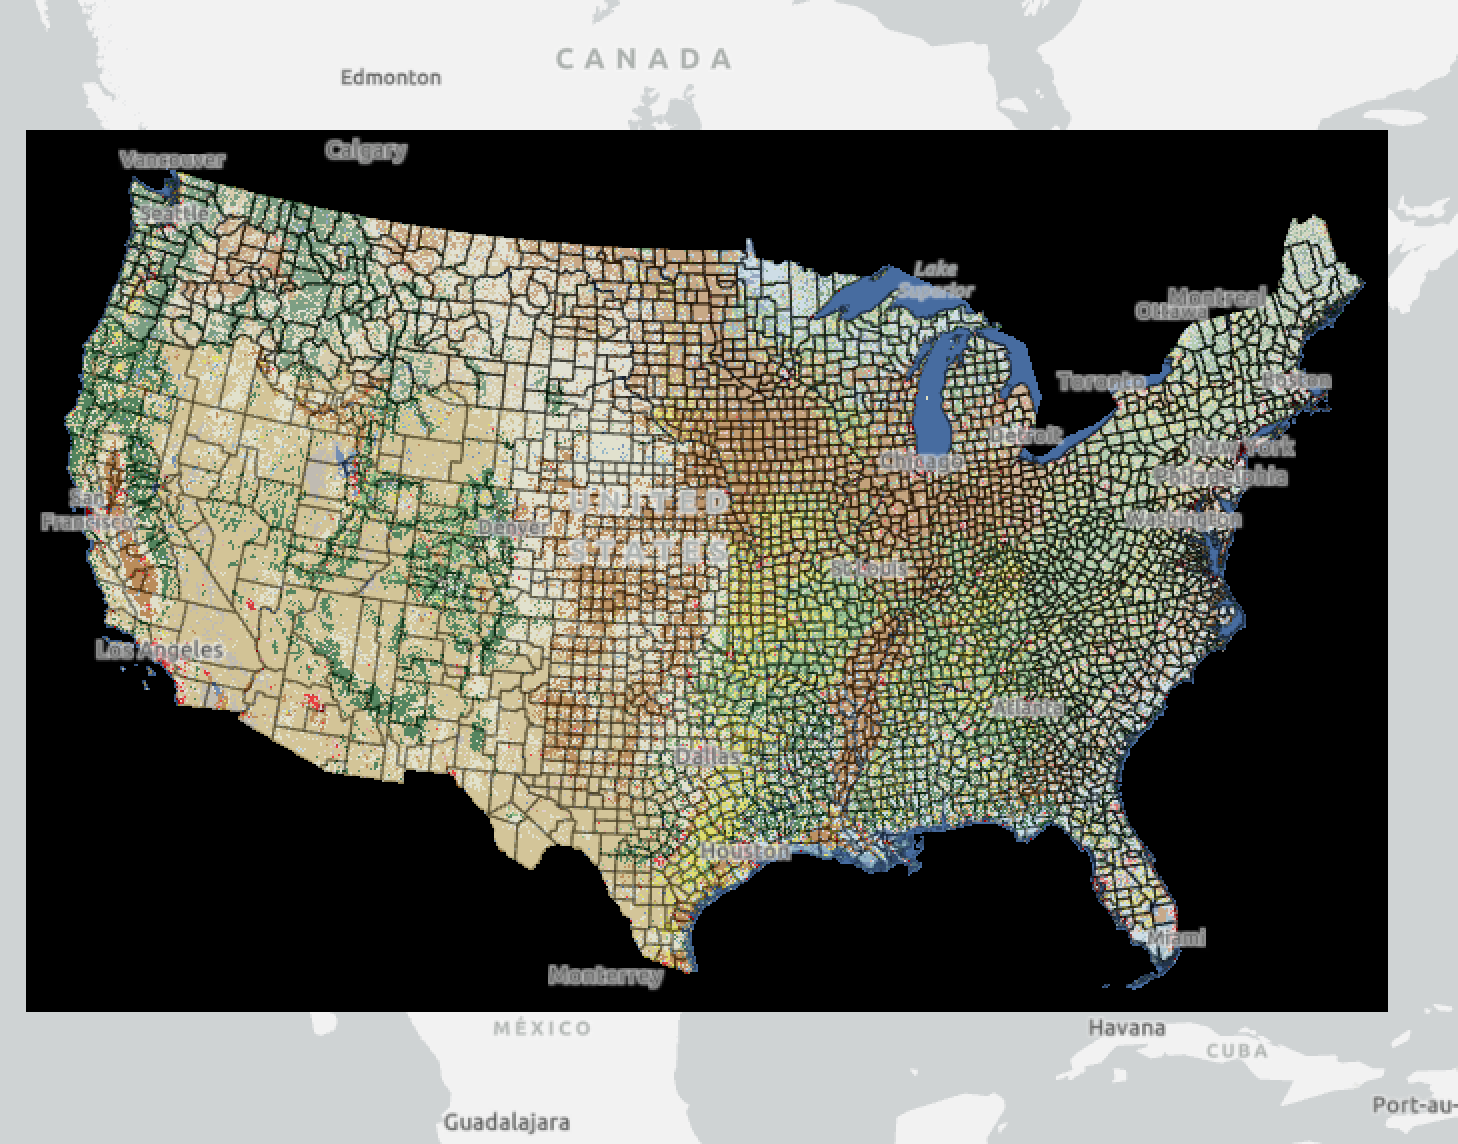
(projection for the map is NAD 1983 ContiguousUSA Albers.)
Tabulate area completes without error (Although takes a lot of time each time and the following table is resulted (with 49 rows of values for states in CONUS and the District of Columbia):
| NAME | UNCLASSIFIED | A_ | OPEN_WATER | PERENNIAL_SNOW_ICE | DEVELOPED__OPEN_SPACE | DEVELOPED__LOW_INTENSITY | DEVELOPED__MEDIUM_INTENSITY | DEVELOPED__HIGH_INTENSITY | BARREN_LAND | DECIDUOUS_FOREST | EVERGREEN_FOREST | MIXED_FOREST | SHRUB_SCRUB | HERBACEUOUS | HAY_PASTURE | CULTIVATED_CROPS | WOODY_WETLANDS |
So I add all values in columns from OPEN_WATER to WOODY_WETLANDS to calculate the total. Then do CULTIVATED_CROPS/total.
I am really confused and don't know what I am missing here.
I would appreciate your helps and suggestions.