Hello! I'm looking for help on several aspects of a feature report. I'm a complete newb to feature reports. I built the survey from scratch using Survey123 Connect and I have learned a lot so far! The end goal of this project is to streamline data management and reduce overall time spent by switching to survey123 with a feature report. The form is designed to collect basic data at one geopoint and include to four photos per geopoint. The feature report is generated from a number of selected points at a given property and I've been using the "merge continous" output setting.
I've been able to get pretty close to the desired output but am spinning my wheels searching for useful help articles at this point. There are three sections to the report- see attached pdf for example of descriptions below.
Map
- How do I remove blue pins for selected features from the overview map?
- I want to include two feature layers from our online org account in the summary map. What's the best way to do that? Do I add those to the survey webmap? Or do I connect the survey results to an existing webmap?
Photopoint Coordinates
Photos
- Photo image caption text. The output formatting is not great. Would be better if could combine all text onto one line. Stuck on property syntax for each image caption. The field for the photo point number is outside of the photo repeat so I’m not sure how to pull it in for the desired formatting. I had the idea to just pull that answer down into the repeat in XLS Connect but haven't figured out how to do so yet.
- I remember seeing something awhile back that highlighted using the form input later in the same form. As in, person puts in Name early on in form and then later in the form it says, “Hey, Name” before the form is submitted
- Tried making a new row in repeat group in XLS form with calculation field if(${pointnum}!",${pointnum},") but it didn't work when I tried it in a published form source link
- Images split from image caption text . The title for the next image does not stay with image. This isn't a high priority but it'd be nice if there were a way to fix this.
- Image size/ratio is inconsistent using take photo vs. browse options. Photo 3 was uploaded and most others were taken directly in app. I prefer the size/ratio of the photo that was uploaded rather than those taken within the app (only testing in Survy123 app because this is how data will be collected)
- Photo order. I know you can sort fields in the attribute table to order by a certain field (date, photo point number, etc) but I'd like to have the report template syntax automatically order the photos by photopoint number and then letter (1a, 1b, 2a, 2b, 2c etc) because I think some users will struggle to remember that step in Survey123.
Here are examples from an existing document
aka these are the feature report output goals 🙂
Photopoint map example from existing document. This map is manually created by staff at this time
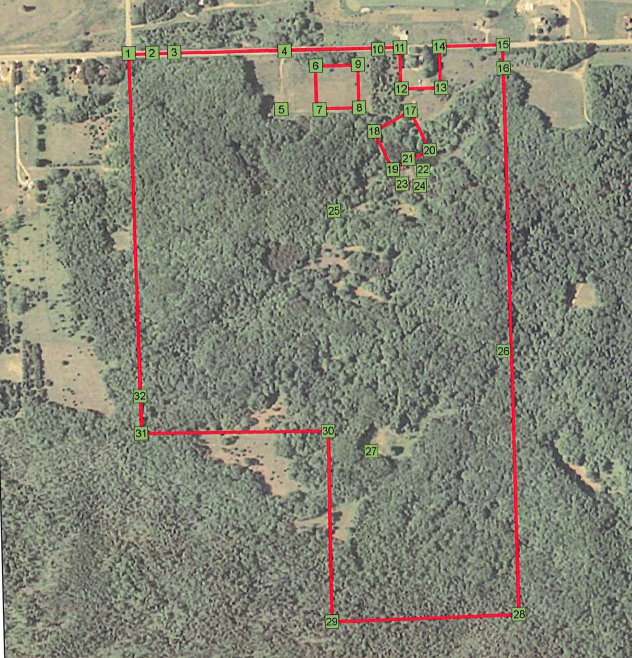 2. Photopoint map example. Red outline is specific to the property and part of a hosted feature layer (example from existing)
Photopoint images and description. The photopoint images and captions are manually created by staff at this time. The text box below describes how the information corresponds to the form design. The attached XLS form has the rows highlighted in same colors.
 3. Photopoint images and description text (example from existing)



