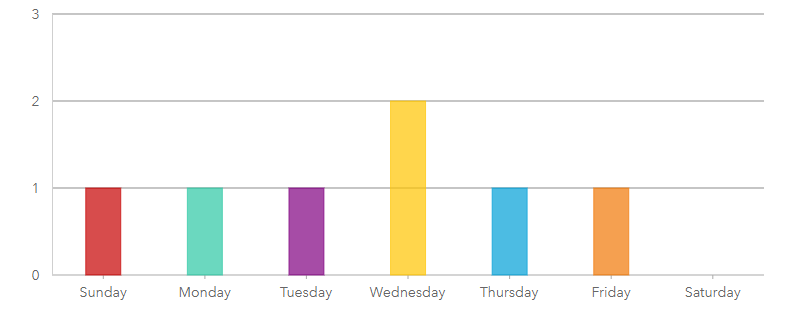
I've created a Survey123 questionnaire, but I would like to show the results in an Operations Dashboard. Some of my questions are multiple choice and I would like to show the number of times a user selects each choice. Basically, I want to show in Ops Dashboard a graph just like the one that Survey123 automatically generates. I can't seem to figure it out, though!
Here is what Survey123 looks like:
and here is what my Ops Dashboard looks like:
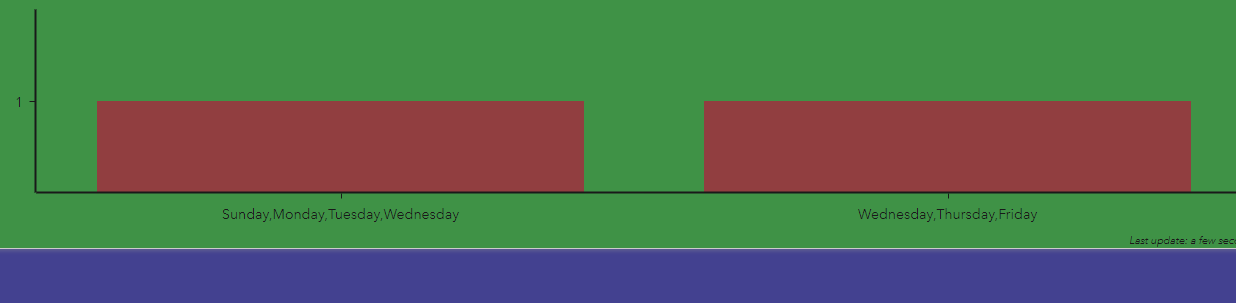
I feel like I've tried everything, but I just can't seem to get those values to ungroup in the graph! I want to know how many people choose each day of the week, not how many options there are with seven choices.








