I need a better understanding about reading server stats.
I have like a total of 10-12 map services. All hosted on AWS, single server.
I monitor all of them by reading their Total Request, Maximum Running Instances, Average Response Time and Maximum Response Time.
Here is the data:
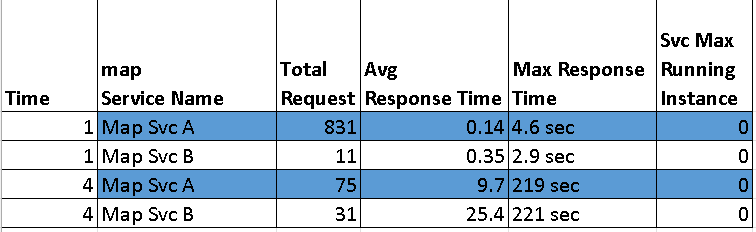
My biggest question is how on earth "Map Svc A"with Total Request of 831 at Time 1 has Average response time of under 1 second whereas "Map Svc B" with Total Request of just 31 has max Response Tme of 221 seconds ? At time 4, all both Map Services A and B are really slow.
What is going on ? How to read the server stats correctly ?
Here is some graphics to give general idea.
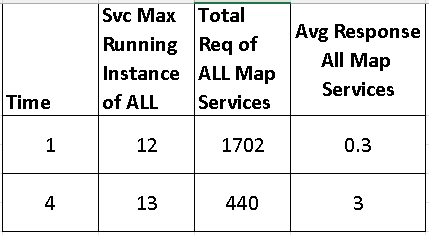
The graphic below shows the Max Running Instances, Total Request and Average Response of ALL Map services at both times, 1 and 4.
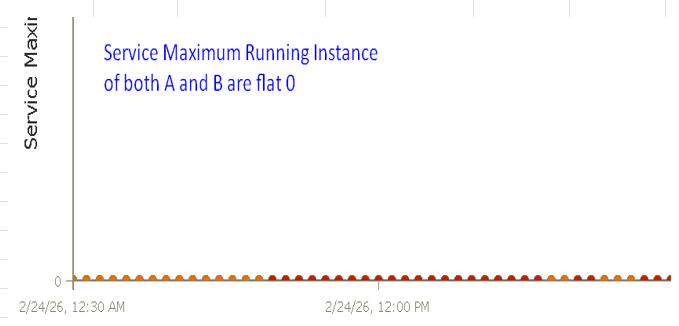
The graphic below shows that Service Maximum Running Instances all 0.
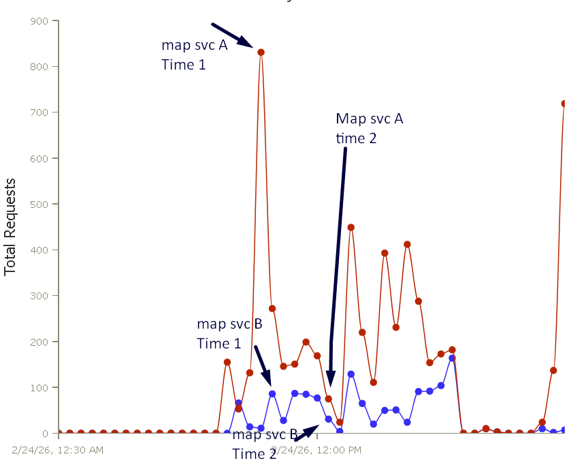
Here is the graphic about Total Request of Map Service A and B at two different times:
Here is a graphic about Average Response Time:
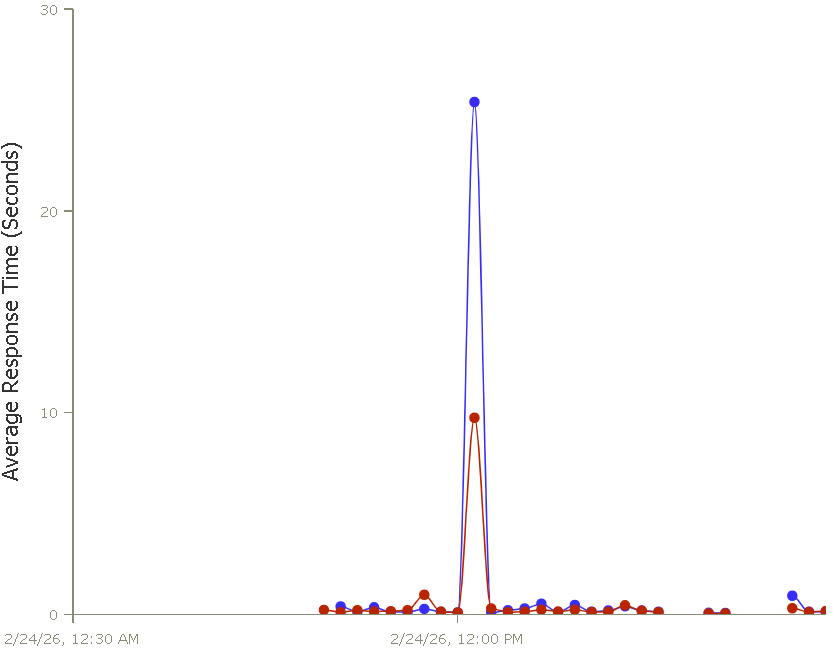
Any explanation welcome. I want to understand it better..
Thanks



