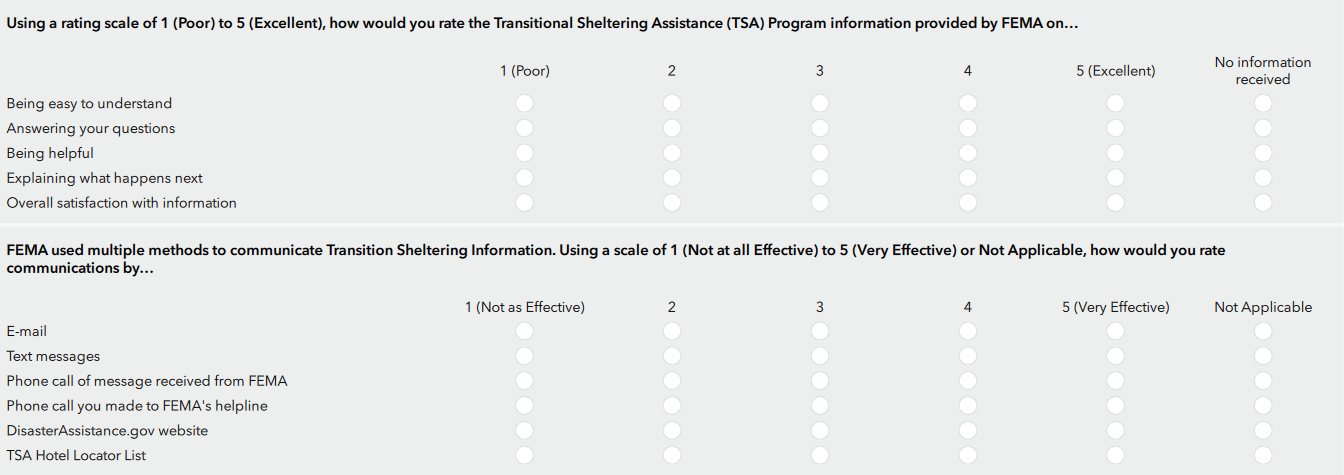
Hey all, I created a survey using an xlsform and used the table-list appearance. I really like how the survey looks but I'm having trouble with visualizing this information on a dashboard. Each option "being easy to understand," "answering your questions," are all an individual field with the same domains. The question itself is an individual field with no domains.
When trying to visualize this information on a dashboard or webapp, how can I group this question to all of these answers? I want to be able to select a question, and all answers with their ratings appear.