Hi,
I'm relatively new to using Arcade and I have been scouring the Internet, trying to figure out how to use Arcade Expressions for the List widget on Dashboard. I am simply trying to display my data like a table, using the List widget. I know that a Table widget is currently in the works but, in the meantime, I would like to use Arcade within the List widget to display my data.
So far, I haven't had any luck getting my data to display in the List widget when using Arcade Expressions. The "Feature" functions don't work for me at all and I only have "$datapoint" available as my Global functions. I don't understand the difference between the two.
I have found a few posts where people are using Arcade to display their data in a table format but, I have tried to replicate their expressions with no success.
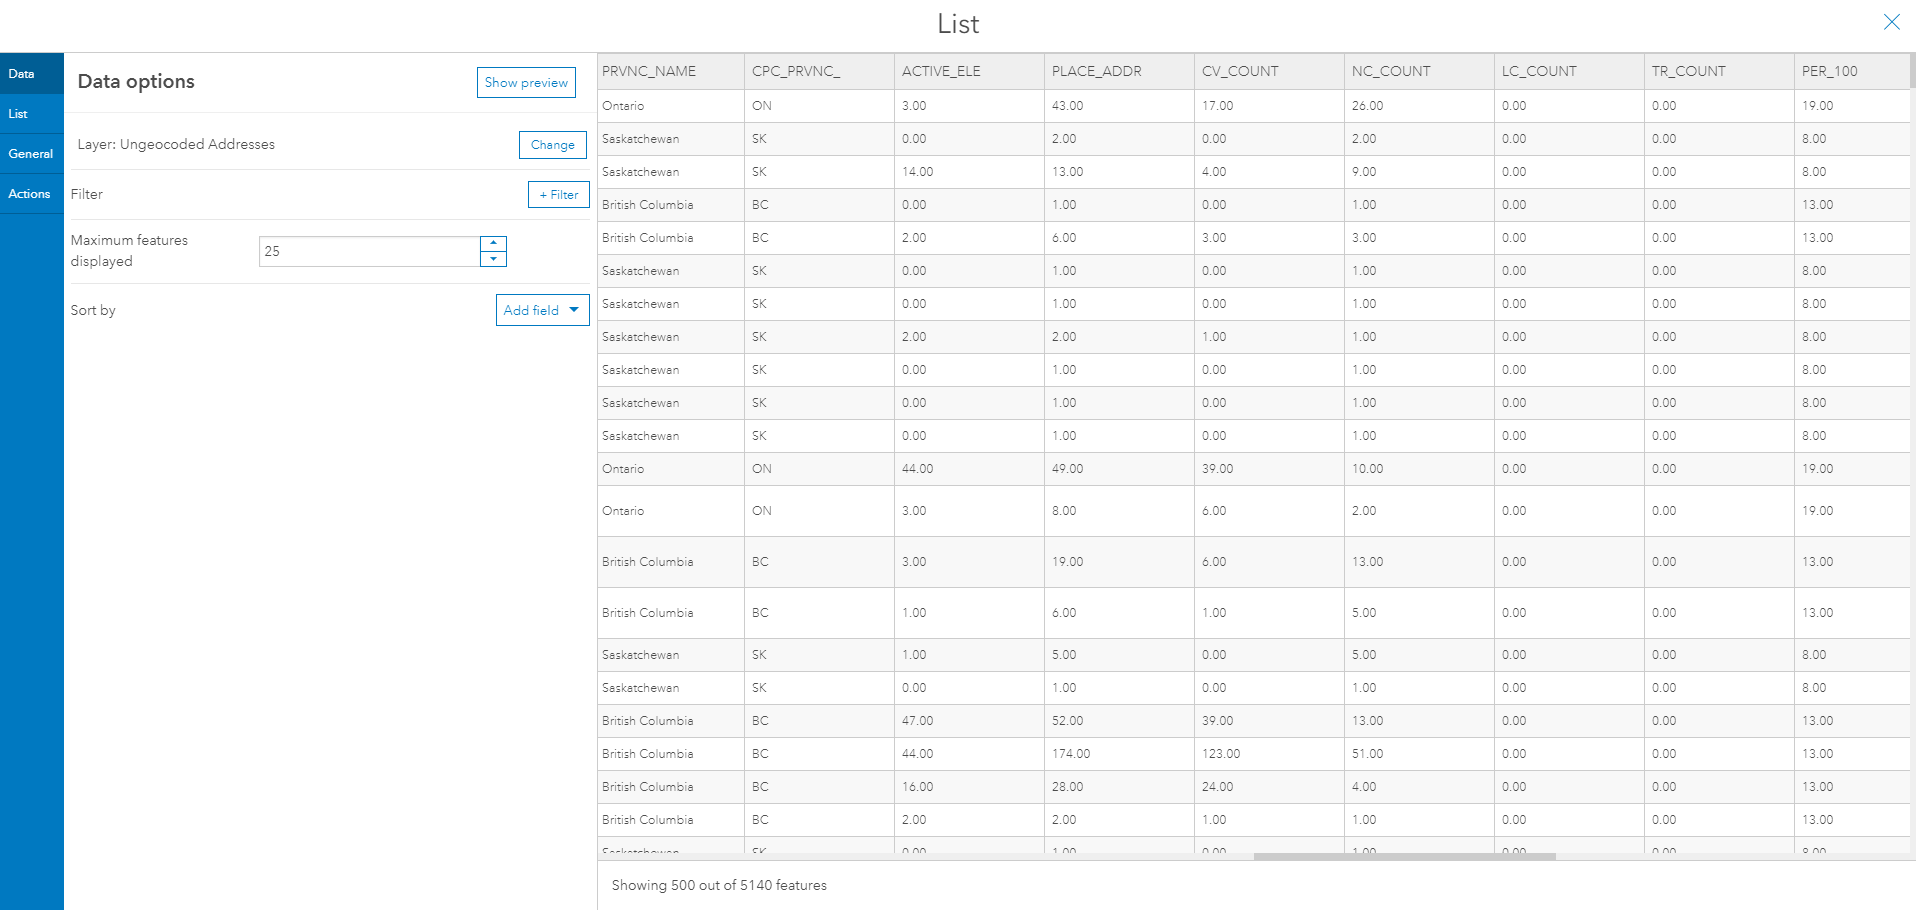
Here is my data:
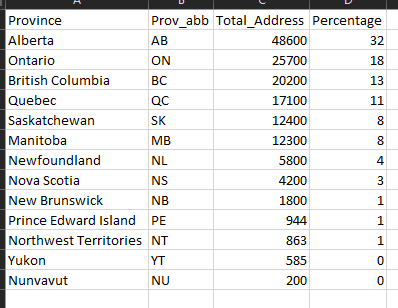
I'm hoping to display the data in a table and for it to look something like this:
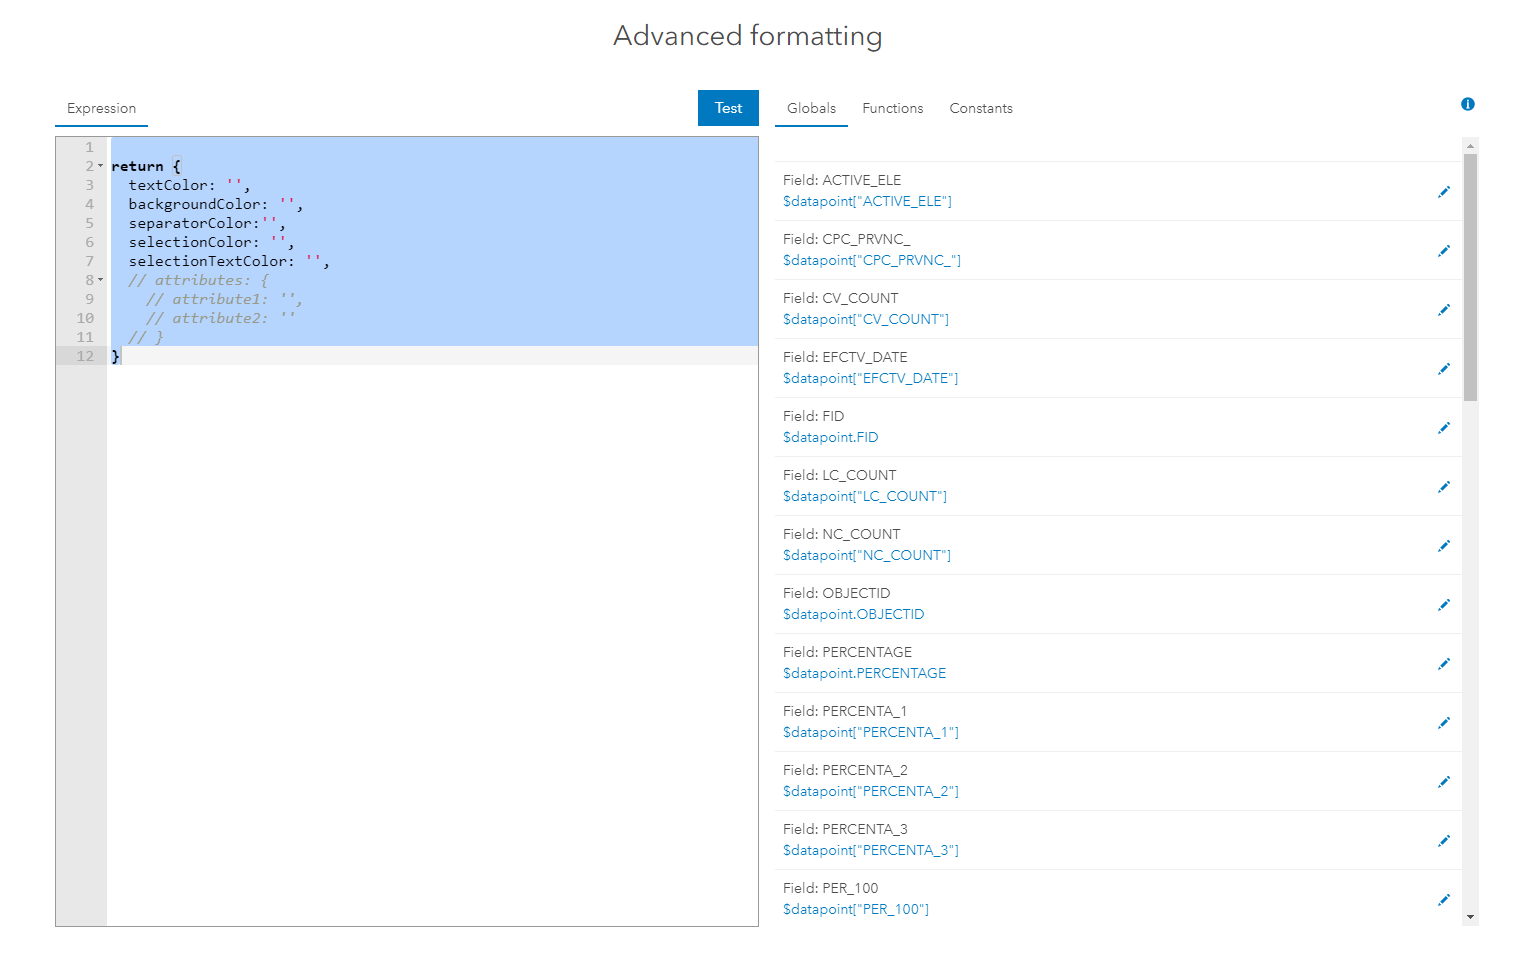
And here's how it gets displayed in under the Advanced Formatting, in the List widget:
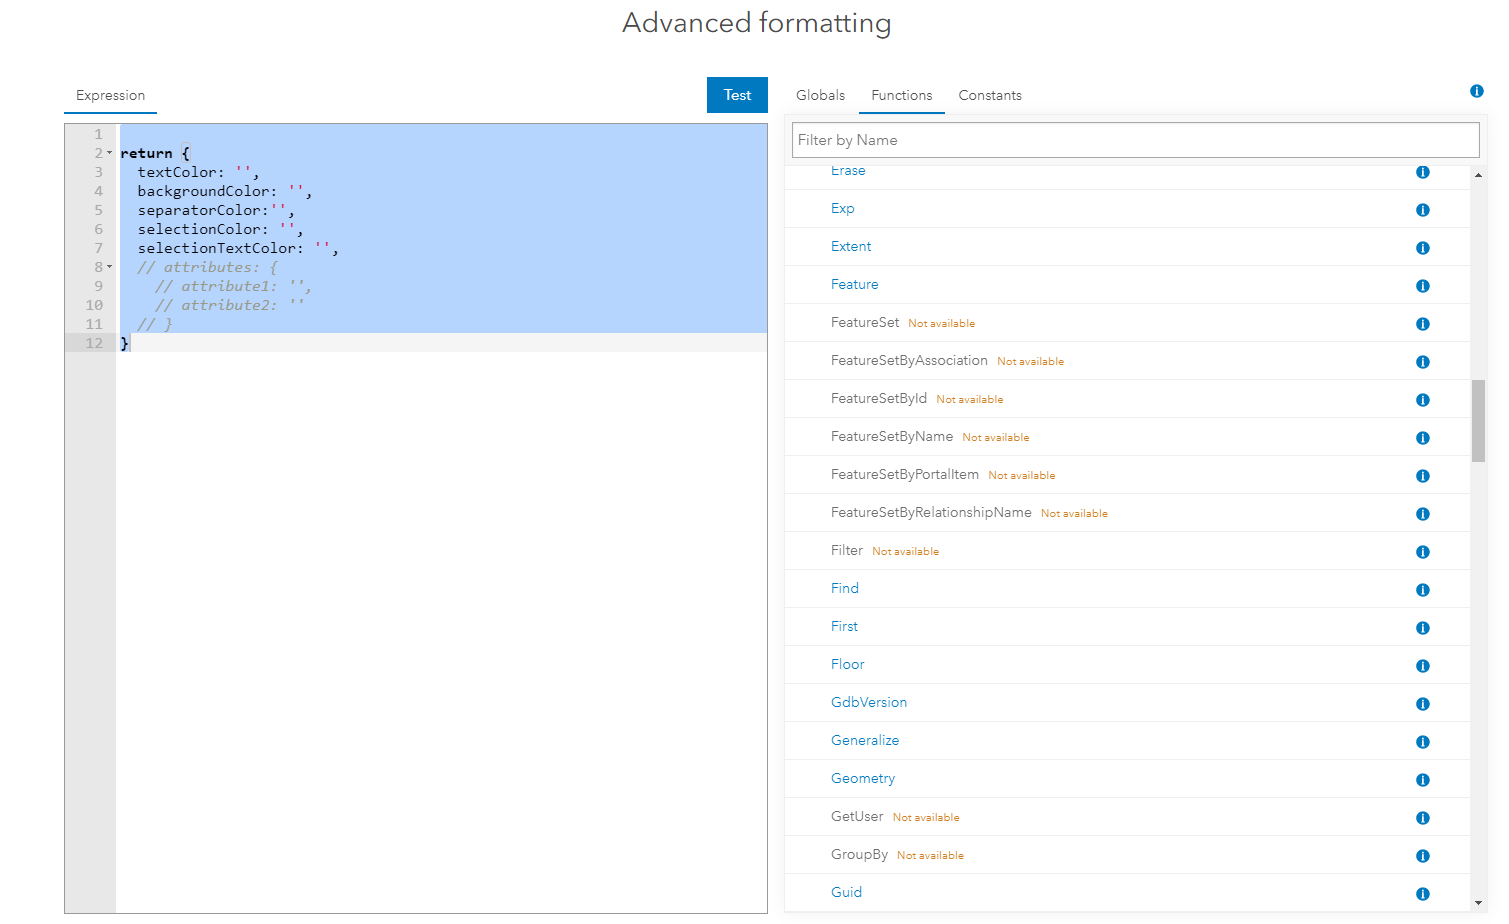
As you can see, FeatureSet, FeatureSetByAssociation, etc. are unavailable to me. I also tried using any function with my data just to see what it would look like:
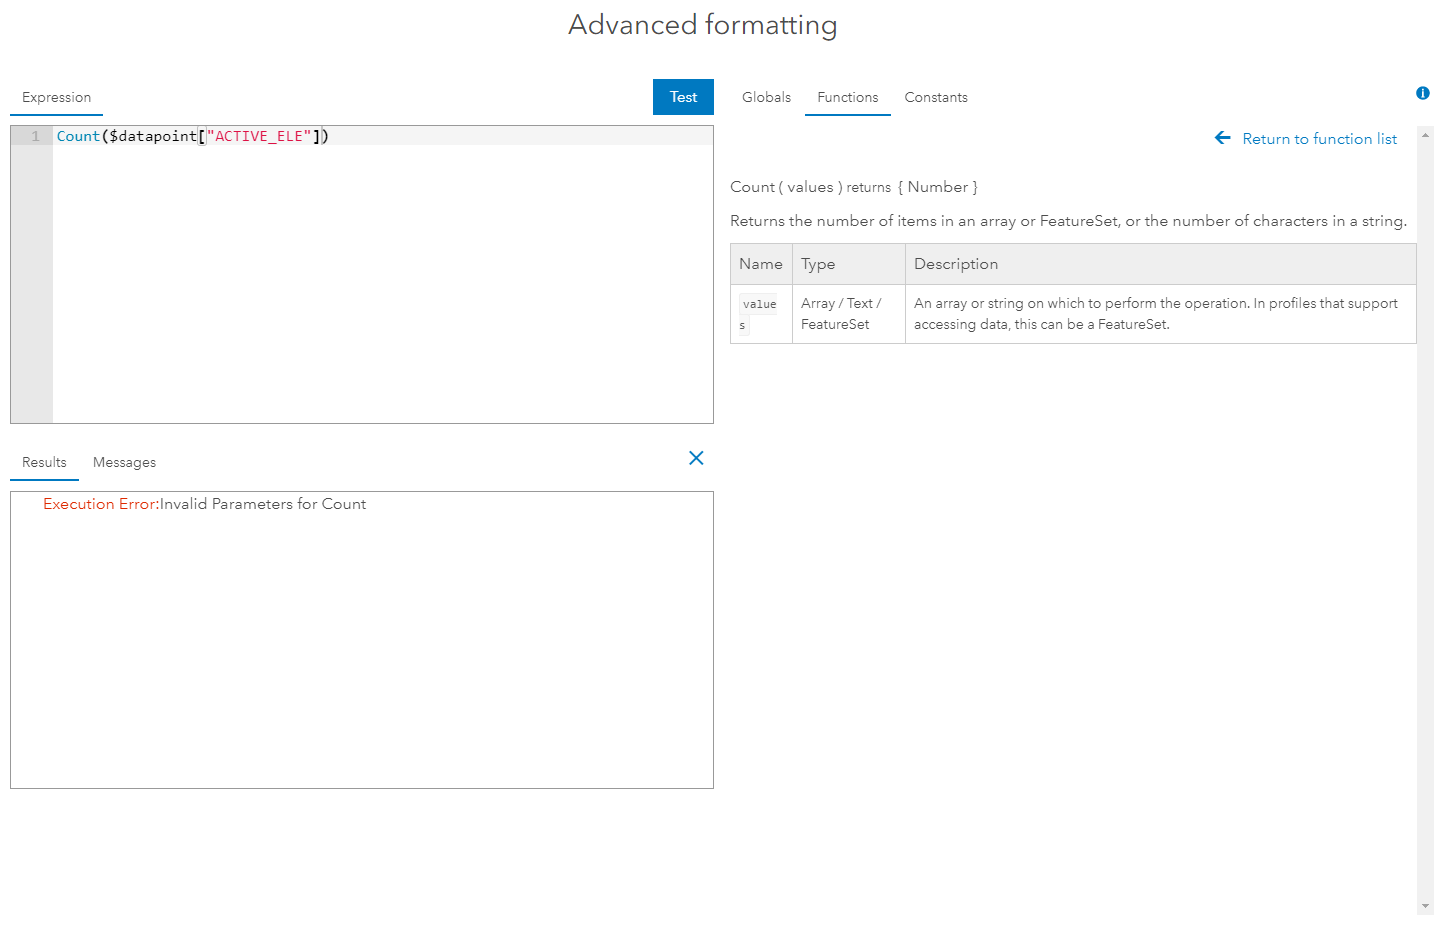
And it doesn't work as I have to use FeatureSet.
Is there anything wrong with my data? I don't know how to get "FeatureSet" to display on the List widget. I looked to see if FeatureSet was available to me in the pop-ups and it is:
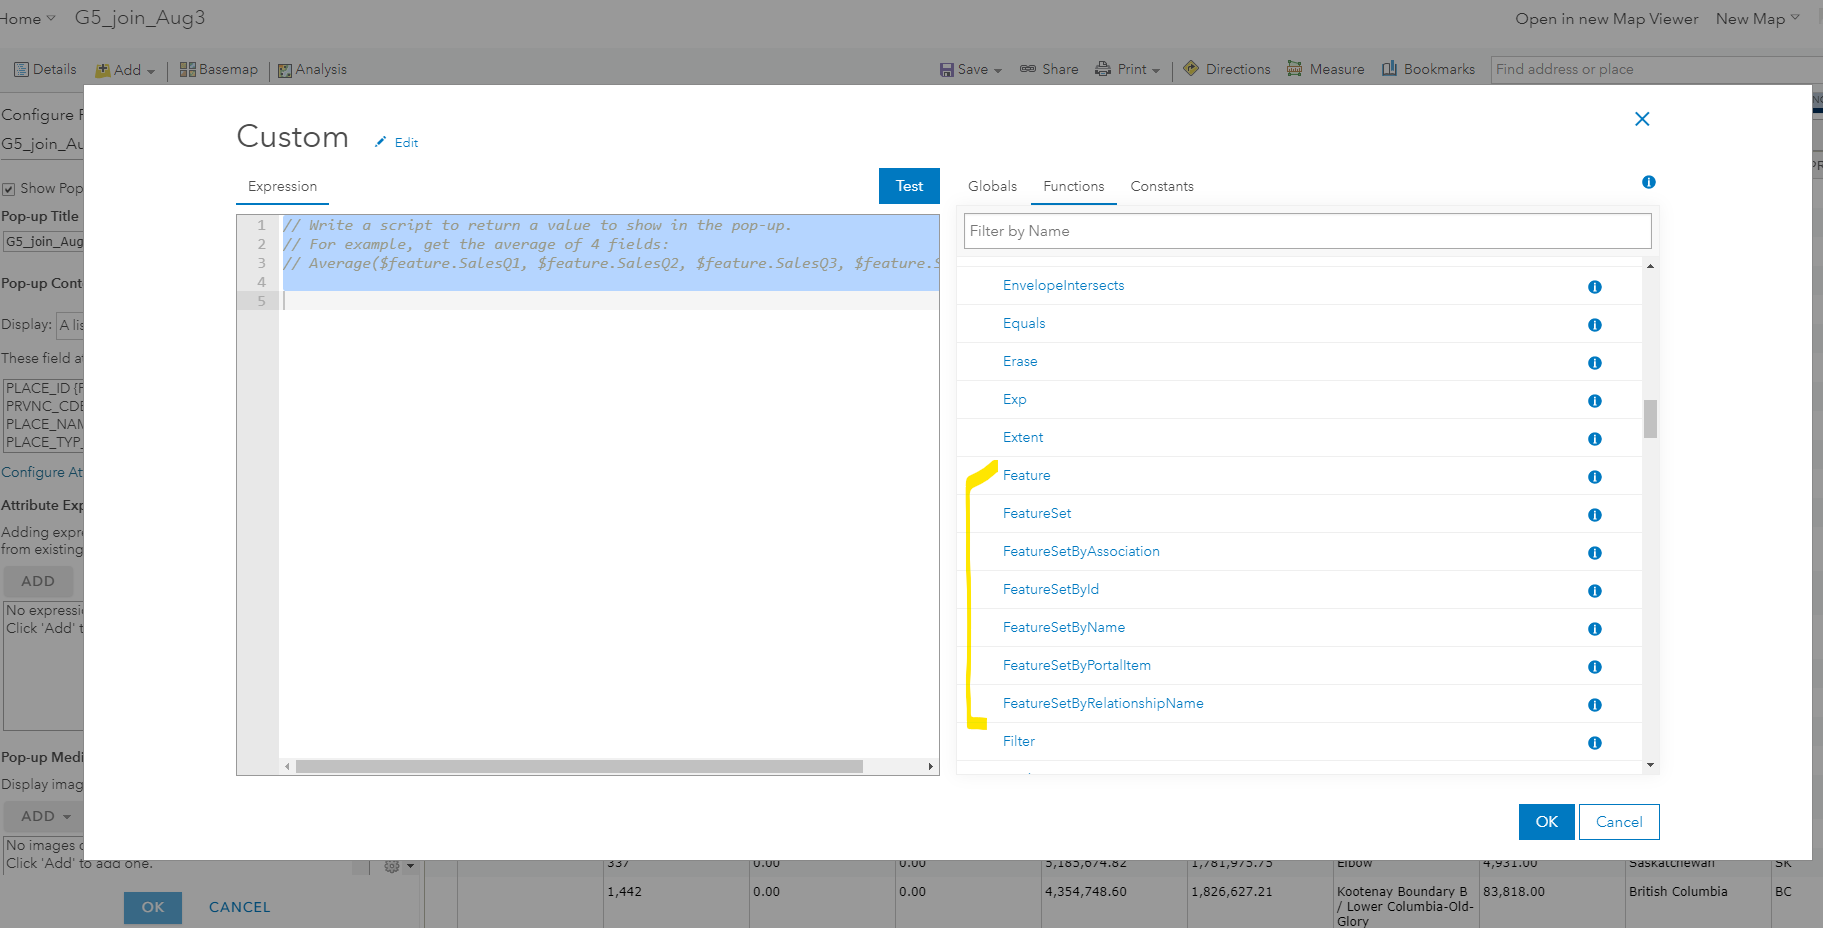
I tried following these instructions to display my data in the List widget, in a table-like format: https://community.esri.com/t5/arcgis-dashboards-questions/arcade-dashborad-add-new-values-into-hosted-table/m-p/1079568
Any insight would be helfpul!
Thank you,
Jenny




