- Home
- :
- All Communities
- :
- ArcGIS Topics
- :
- GIS Life
- :
- GIS Life Blog
- :
- GIS for Dummies - Thanksgiving Style
GIS for Dummies - Thanksgiving Style
- Subscribe to RSS Feed
- Mark as New
- Mark as Read
- Bookmark
- Subscribe
- Printer Friendly Page
Happy Thanksgiving, everyone! (at least, it is Thanksgiving time in the US). I thought this would give me a fun chance to write a blog post on “GIS for Dummies”, but with a cooking/recipe twist, Thanksgiving style. Some folks at my office and I came up with this idea and this would be a good place to share it.
For starters, this is GIS:
GIS: A Map, But More Than a Map
- A way to capture, store, manipulate, analyze, and present data
- A series of layered geospatial data organized in one space
- A way to solve problems and answer complex questions
However, let’s make it fun so that anyone can understand.
GIS for Dummies Recipe
Ingredients
Take:
- 4 parts Database
- 1 1/2 parts Geographic Data
- Points, Lines, Polygons, Rasters, DEM, and 3D Data
- 1 part Data from Forms / Spreadsheets (Tabular Data)
- Address Lists, GPS Coordinates, and Files
- 1/2 part Basemap
- Satellite Imagery, Street Map, Topography
- 3 parts Graphics
- Graphical User Interface (GUI) and Mapping Tools
Combine
- In a large Database: Stir Geographic Data with Tabular Information
- Geocoding, Database Design, Make Event Layers
- Select a non-stick User Interface and press Basemap evenly into the Corners
Process
- Preheat the GIS toolbox to Automate Tasks using Models or Scripts
- Divide Data mixture evenly into Feature Layers
- Sift and Fold the Feature Layers into Geoprocessing and Analysis tools
- Perform Analyses, Generate Statistics, and Analyze Networks
Finishing Touches
- Glaze with Thematic and Map Elements to tell the Story
- Symbols, Labels, Layout, Legend, North Arrow, and Scale Bar
- Trim excess and Overlay Layers
- Demonstrate Statistical Hotspots and Illustrate Spatial Patterns
- Cool the map on a Web Server for Publishing
- Interactive Maps highlight Spatially and Temporally Dynamic data
- When baking at a high altitude, use Custom Widgets to show Data Trends
- Decision-makers see Correlations and answer Complex Questions
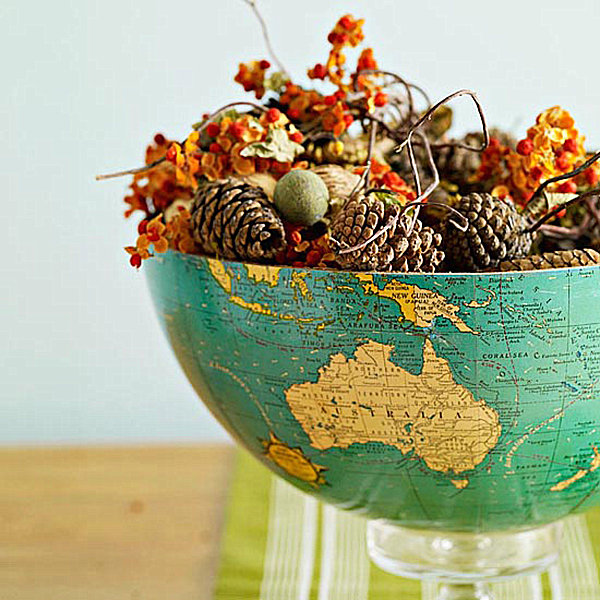
(this image was too cool not to post! source: decoist.com)
I would love to hear what y’all think about this and would love to hear of anything I should add/take away from this as well. I can continue to update it. ![]()
title Image source: pixabay.com
You must be a registered user to add a comment. If you've already registered, sign in. Otherwise, register and sign in.
