- Home
- :
- All Communities
- :
- Developers
- :
- JavaScript Maps SDK
- :
- JavaScript Maps SDK Questions
- :
- Displaying grid lines for tetrads
- Subscribe to RSS Feed
- Mark Topic as New
- Mark Topic as Read
- Float this Topic for Current User
- Bookmark
- Subscribe
- Mute
- Printer Friendly Page
Displaying grid lines for tetrads
- Mark as New
- Bookmark
- Subscribe
- Mute
- Subscribe to RSS Feed
- Permalink
- Report Inappropriate Content
I am the website developer for Corfu Butterfly Conservation. The site uses the JavaScript SDK in numerous places to show specific locations of butterfly sightings and distribution of species. I have been asked to create a map to show species density. To do this I need to be able to display tetrad grid lines (i.e. grids of 2km x 2km) and then indicate species density using symbols.
I have done plenty of searches to try and find the coding/widgets to achieve this but each time the nearest I get is this page for ArcGIS Maps SKK for .NET.
Is there an equivalent feature for yr JavaScript SDK?
https://developers.arcgis.com/net/wpf/sample-code/display-grid/
- Mark as New
- Bookmark
- Subscribe
- Mute
- Subscribe to RSS Feed
- Permalink
- Report Inappropriate Content
Hi @DavidShearan - sounds like this might be a good use case for binning. Binning is a method of aggregating points by grouping them into predefined bins (kinda like a grid). Here's an example: https://developers.arcgis.com/javascript/latest/sample-code/featurereduction-binning/
If you would still like to display a grid, I would recommend either adding a feature layer that represents a grid (example) or creating your own grid from Graphics. The JavaScript SDK doesn't support adding a grid out of the box just yet, but it is something we are working on for a future release.
- Mark as New
- Bookmark
- Subscribe
- Mute
- Subscribe to RSS Feed
- Permalink
- Report Inappropriate Content
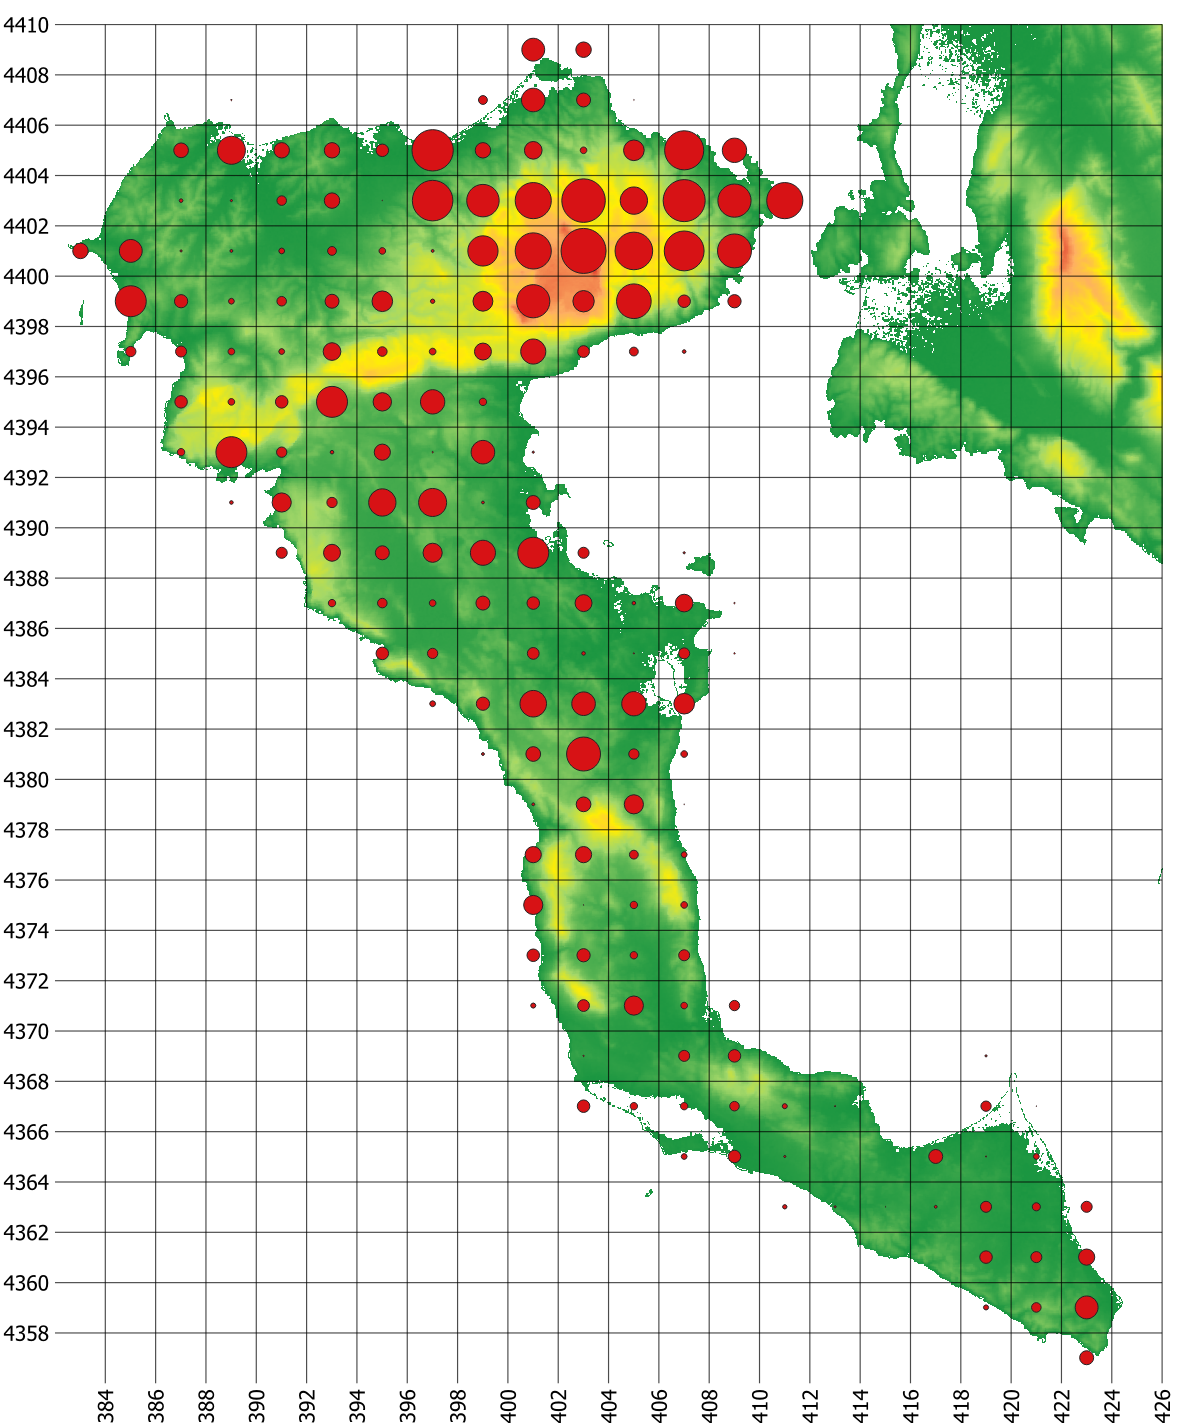
Hello again. The attached image is an example of what I am trying to achieve. The different size circles are an indication of the number of species seen within each tetrad. From my cursory look so far at the suggestions you made I am not sure whether binning fits the bill. What do you think?
- Mark as New
- Bookmark
- Subscribe
- Mute
- Subscribe to RSS Feed
- Permalink
- Report Inappropriate Content
Amazing answer thank you. I will look at this examples and have a play to see if they give me the results I am after