- Home
- :
- All Communities
- :
- Industries
- :
- Education
- :
- Education Blog
- :
- Enhancing Qualitative Social Science Research with...
Enhancing Qualitative Social Science Research with GIS
- Subscribe to RSS Feed
- Mark as New
- Mark as Read
- Bookmark
- Subscribe
- Printer Friendly Page
- Report Inappropriate Content
In a new storymap and a series of videos, I explain why and how you can enhance qualitative social science research with GIS. This storymap and these videos are the result of collaboration that I have been in over the past year with colleagues at Esri, led by our Chief Scientist, Dr Dawn Wright, and in conversations with many in academia during that time period. It is exciting to see many qualitative and social science tools, methods, and data sets become available in the ArcGIS ecosystem. Certainly much work remains, but we are firmly on this pathway and there is no looking back.
If you are an educator, you can use the activities described in the storymap as instructional content in your GIS, sociology, cultural geography, research methods, and other courses, and to spark conversations around the issues raised by the activities in your online and face-to-face courses. If you are a researcher or GIS professional, you can use this content for actionable research methods, approaches, and data sets, to build on or to generate your own ideas from.
I have also created video content to support the above storymap, arranged in five parts, here:
Part 1 of 5.
Part 2 of 5.
Part 3 of 5.
Part 4 of 5.
Part 5 of 5.
The story map begins with the purpose of the storymap and the research and development of qualitative and social science tools and approaches with GIS at Esri and beyond Esri. I discuss the social science collaborative at Esri, and then review types of data, spatial, quantitative, and qualitative, the relationships between methodologies, the research cycle, This is all contained in the first video above.
Next, the storymap covers collection, mapping, analysis, and communication of qualitative and social science research and how tools such as ArcGIS Online, ArcGIS Hub, field tools, and others in the ArcGIS ecosystem can support these types of research. I then describe a brief history of the social implications of GIS, social science examples including one of my favorites, The Voices of the Grand Canyon, and a story map on Electric Vehicle attitudes, and another one from grade 6 students and their teacher focused on the Four Corners area in southwest Colorado. I then remind the reader about the higher, nobler goals of using GIS through my study with a colleague of the Lakota language. This is all contained in the second video above.
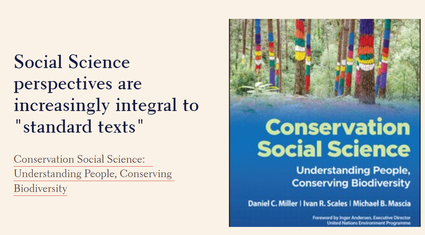
Next, I discuss how social science perspectives are increasingly integral to ‘standard textbooks’ and to ecological studies; I dig into visual storytelling research and methods, and make the case that GIS use outside of GIScience is expanding—into sociology, fine arts, economics, mathematics, music, and other fields. I then discuss how social science methods can be incorporated into a neighborhood study using my own freeway impacts study. I then illustrate how ethics can be effectively taught using GIS and the methods described in this story map. This is all contained in the third video above.
The next section describes how these perspectives can be used to create a GIS lesson that combines behavior, business analytics, and art. Data collection, creation, and analysis tools are then described, followed by sharing with ArcGIS Hub, instant apps, dashboards, and story maps. It is the combination of configurable apps, such as my walkability study, that makes these tools approachable and doable, even by non-GIS people. This is all contained in the fourth video above.
In the final section, I discuss how big qualitative datasets can be explored, mapped, and analyzed, with an encouragement to not stop at mapping your data, but to conduct some spatial analysis on the mapped data. I describe participatory field sketching with ArcGIS Survey123 as one method, that my colleague and I used in our survey and study on “Where is the American Midwest?”. I follow this with recommendations, considerations, and challenges that still remain with regards to qualitative social science data and methods in a GIS. Finally, I describe ways to move forward in your own learning in this area—articles, lessons, and books. This is all contained in the fifth video above.
Selected images from the story map and videos appear below.
I do hope this is useful and I welcome your input as to how you use these resources and what additional resources you would like to see in the qualitative and social sciences sphere.
--Joseph Kerski
You must be a registered user to add a comment. If you've already registered, sign in. Otherwise, register and sign in.
-
Administration
57 -
Announcements
65 -
Career & Tech Ed
1 -
Curriculum-Learning Resources
225 -
Education Facilities
24 -
Events
59 -
GeoInquiries
1 -
Higher Education
556 -
Informal Education
272 -
Licensing Best Practices
63 -
National Geographic MapMaker
25 -
Pedagogy and Education Theory
205 -
Schools (K - 12)
282 -
Schools (K-12)
227 -
Spatial data
28 -
STEM
3 -
Students - Higher Education
240 -
Students - K-12 Schools
114 -
Success Stories
33 -
TeacherDesk
1 -
Tech Tips
92
- « Previous
- Next »


