- Home
- :
- All Communities
- :
- Products
- :
- ArcGIS Survey123
- :
- ArcGIS Survey123 Blog
- :
- Survey123 Tricks of the Trade: Summary sections in...
Survey123 Tricks of the Trade: Summary sections in reports
- Subscribe to RSS Feed
- Mark as New
- Mark as Read
- Bookmark
- Subscribe
- Printer Friendly Page
- Report Inappropriate Content
The original release of the Survey123 report capabilities centered around the notion of producing reports for individual records. With each Survey123 update, we progressively expand the report template syntax to help you build better reports. In this blog, I want to explore in detail summary sections, which were added in our July 2020 update. The content of the blog is not for beginners. I assume that you are already familiar with creating your own report templates. If not, I suggest you learn the basics from the following resources:
- ArcGIS Survey123: Create Feature Reports - YouTube A quick, yet informative 7 minute video.
- https://community.esri.com/groups/survey123/blog/2019/07/23/understanding-survey123-feature-reports A 15 minute read.
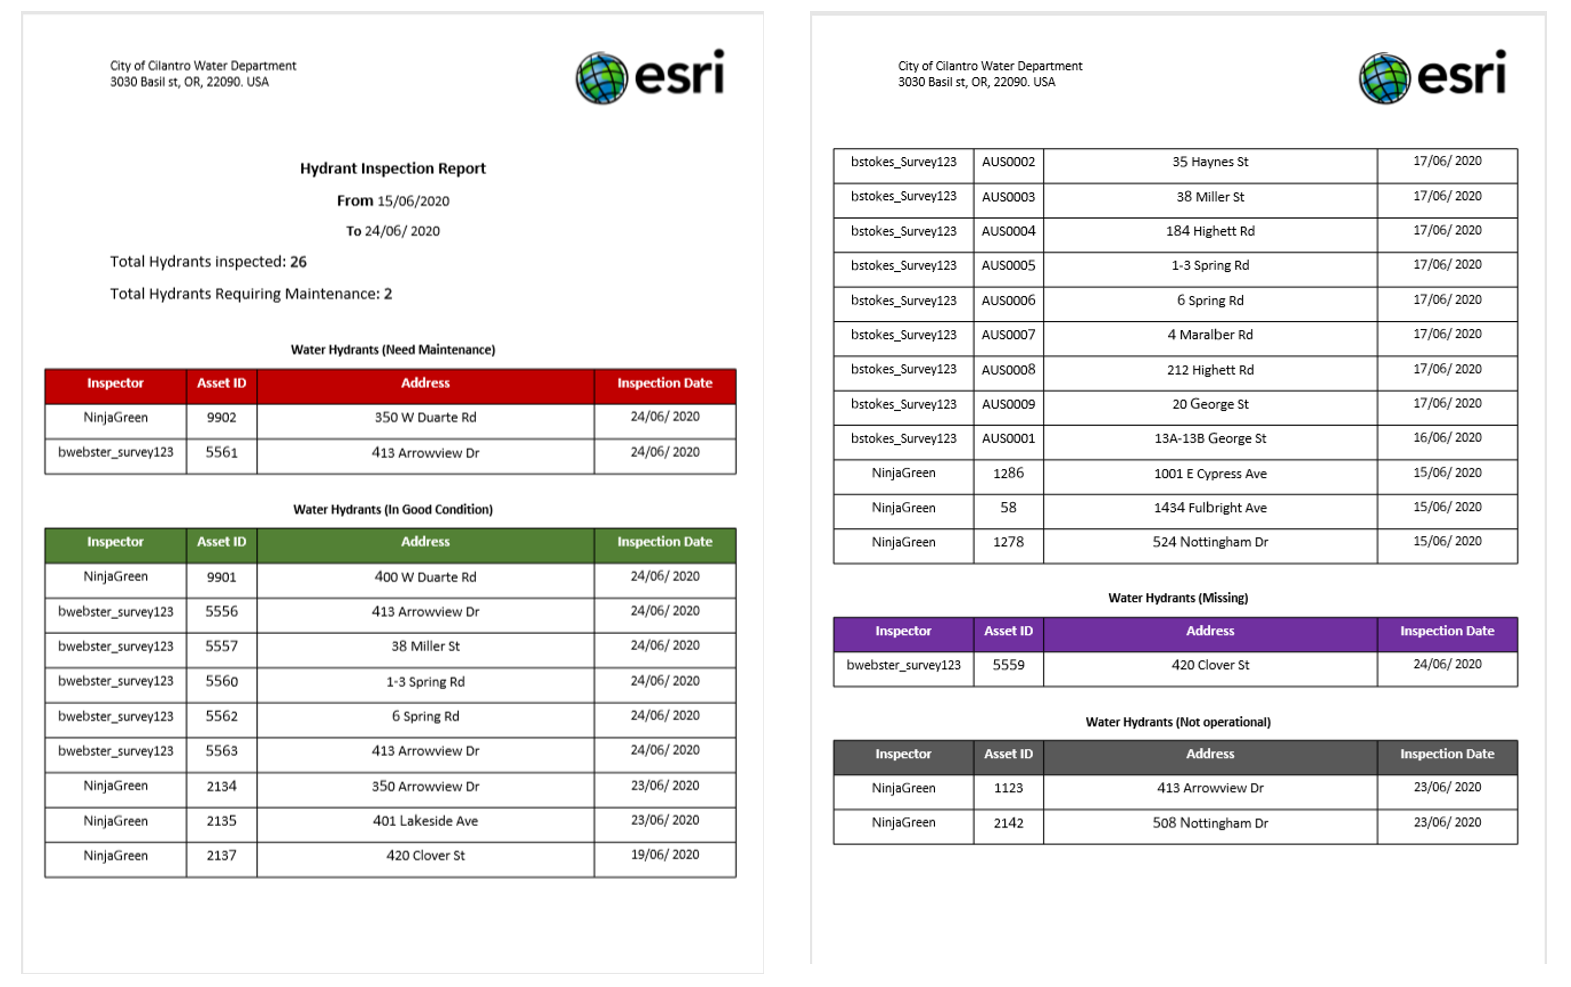
Summary sections are generally used to create a single report for a collection of survey records. This would commonly be referred to as a 'summary report'. Below is an example of a Hydrant Inspection Report that illustrates this concept. Note that tables are used to categorize and report all the hydrants that have been inspected within a certain period. You can click on the image to enlarge it.
Other examples where you may want to use reports like this include include:
- Code violations by district report
- Monthly hydrant inspections report
- Property damage assessments by severity report
- County household survey summary
A great way to get started with summary reports is to generate a Summary sample template on the Survey123 website.
The sample template demonstrates some useful summary syntax. You can then combine what you learn from the template with the Survey123 documentation to adapt the sample into your own report template.

In this blog, I will show you how to build a template completely from scratch. I want to do it that way, because I want to describe some aspects of the report template design process that will not be apparent when using the sample template.
The best way to follow this blog is hands-on. Set aside 90 minutes or so and let's build the hydrant report together.
Setting up the hydrant inspection survey sample
Before you can create a report template you need a survey with some data. We will use the Hydrant Inspections sample template that comes with Survey123 Connect:
- Open Survey123 Connect and sign in using an account with publishing permissions.
- Click on New Survey, and look for the Hydrant Inspection form in the Community group.
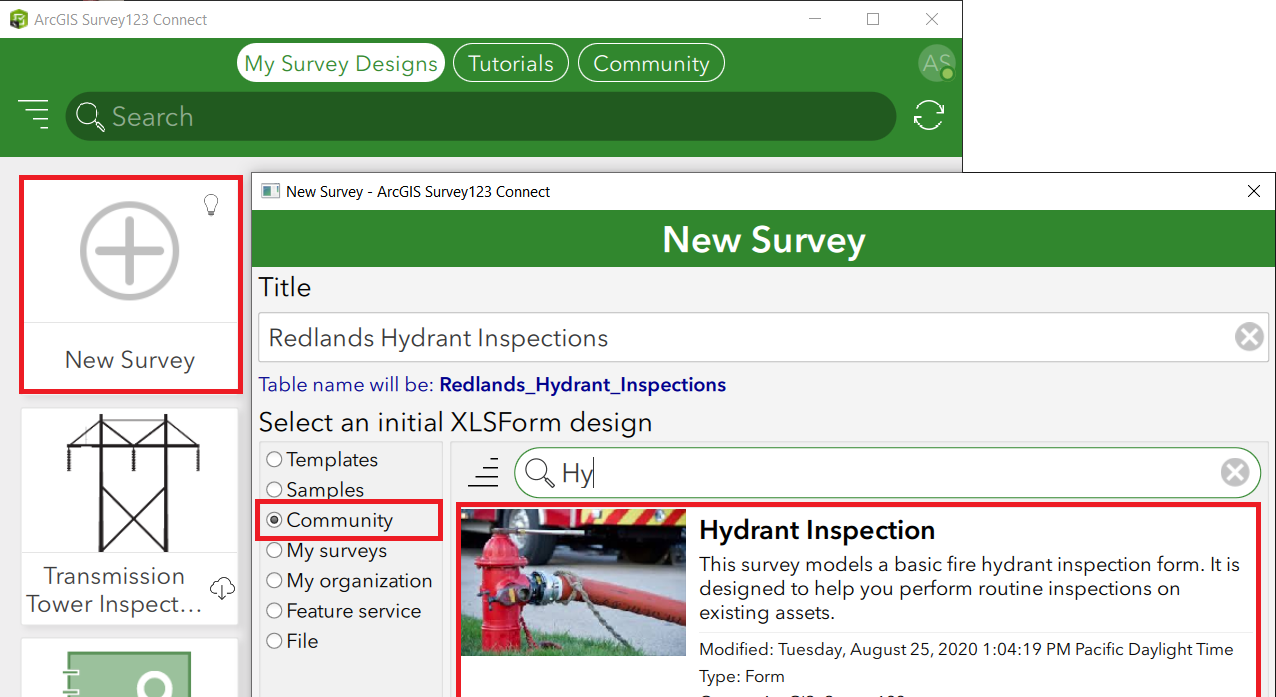
- Make sure you set your own title for the form. In my case, I will call it Redlands Hydrant Inspections.
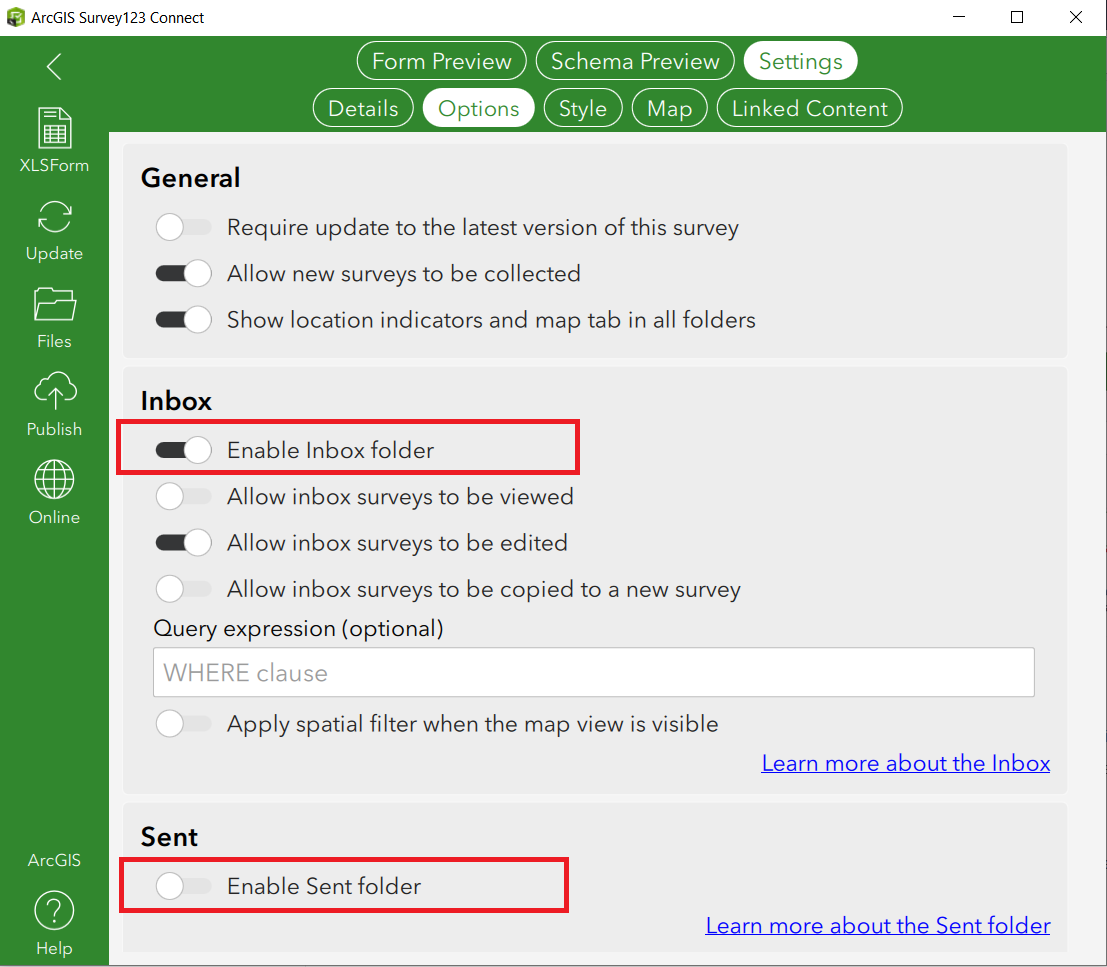
- Before you publish your survey, go to the survey's Options dialog and enable the Inbox and disable the Sent folder.
- Publish your survey and add three or four of records using the Survey123 field app.
Now that we have a survey and some data in it, let's proceed with the creation of our report template.
Getting started with the report template
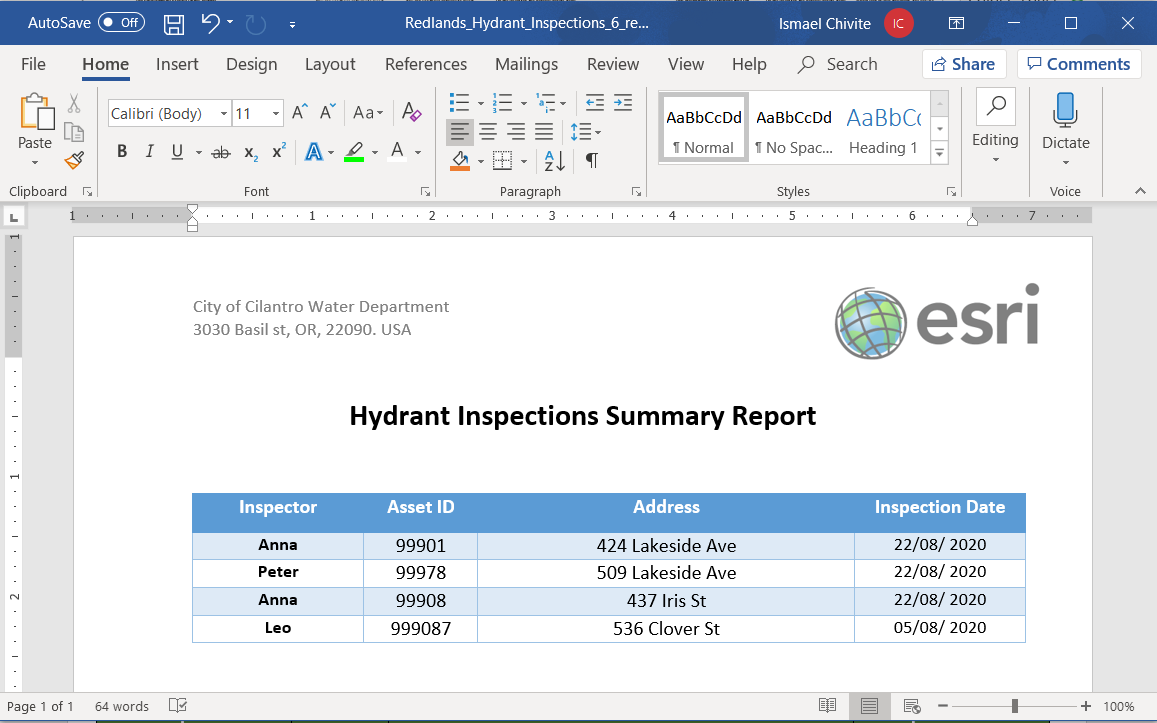
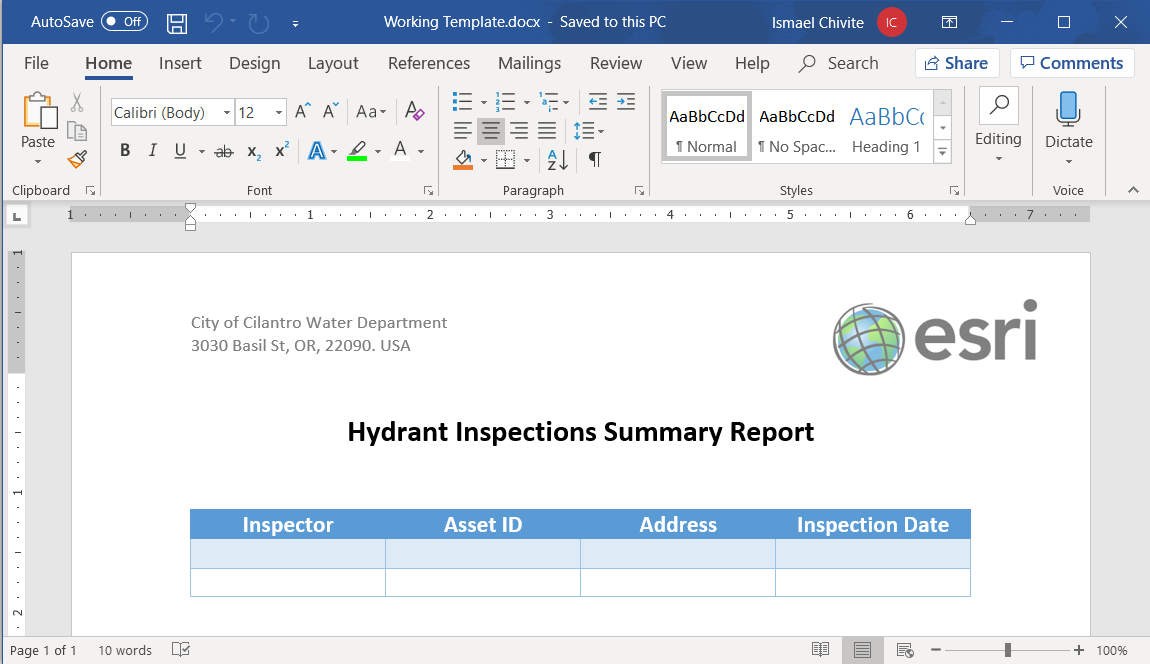
We are going to progressively build up our hydrant report template. To get started, we will add a header, footer, title and a table to display a survey record selection. Below is a screenshot of our initial goal. From this humble beginning, we will add more and more contents one step at a time.
Headers and Footers
Adding a custom header and a footer to your template is generally a good practice. A descriptive header and footer make your report more presentable and provide useful information. Headers and footers cannot include Survey123 report placeholders, but you can insert Microsoft Word autotext elements and static information that will be displayed across all pages in your output report. In my case I added an Esri logo and a fictitious address in the header. In the footer, I inserted autotext to automatically display the date when the report is created and also the page number.
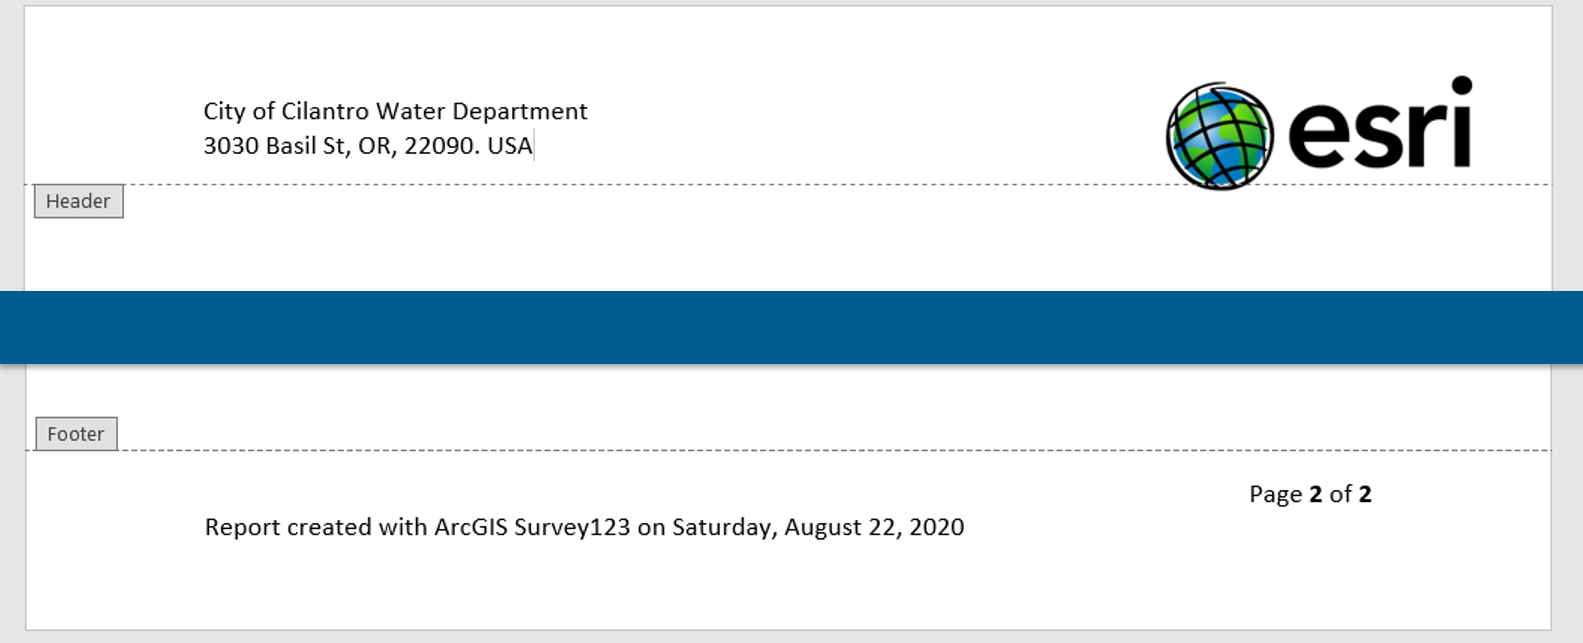
You can add other Microsoft Word design elements, such as page borders, watermarks and backgrounds. Make sure you use these features wisely as they can help give your reports a professional touch.
Title and Table (Basic setup)
Next, we will add a title and a table into our report, as shown below. The table will display a handful of attributes from the survey records. For now, simply add a title and a table as shown below.
Understanding summary sections
Our template is still incomplete, but let's upload it to see how it works.
- Sign in into survey123.arcgis.com.
- Open the Data tab for your hydrant inspection survey. You should see the records you added earlier.
- Open the Feature Report panel and click on the Manage templates link.
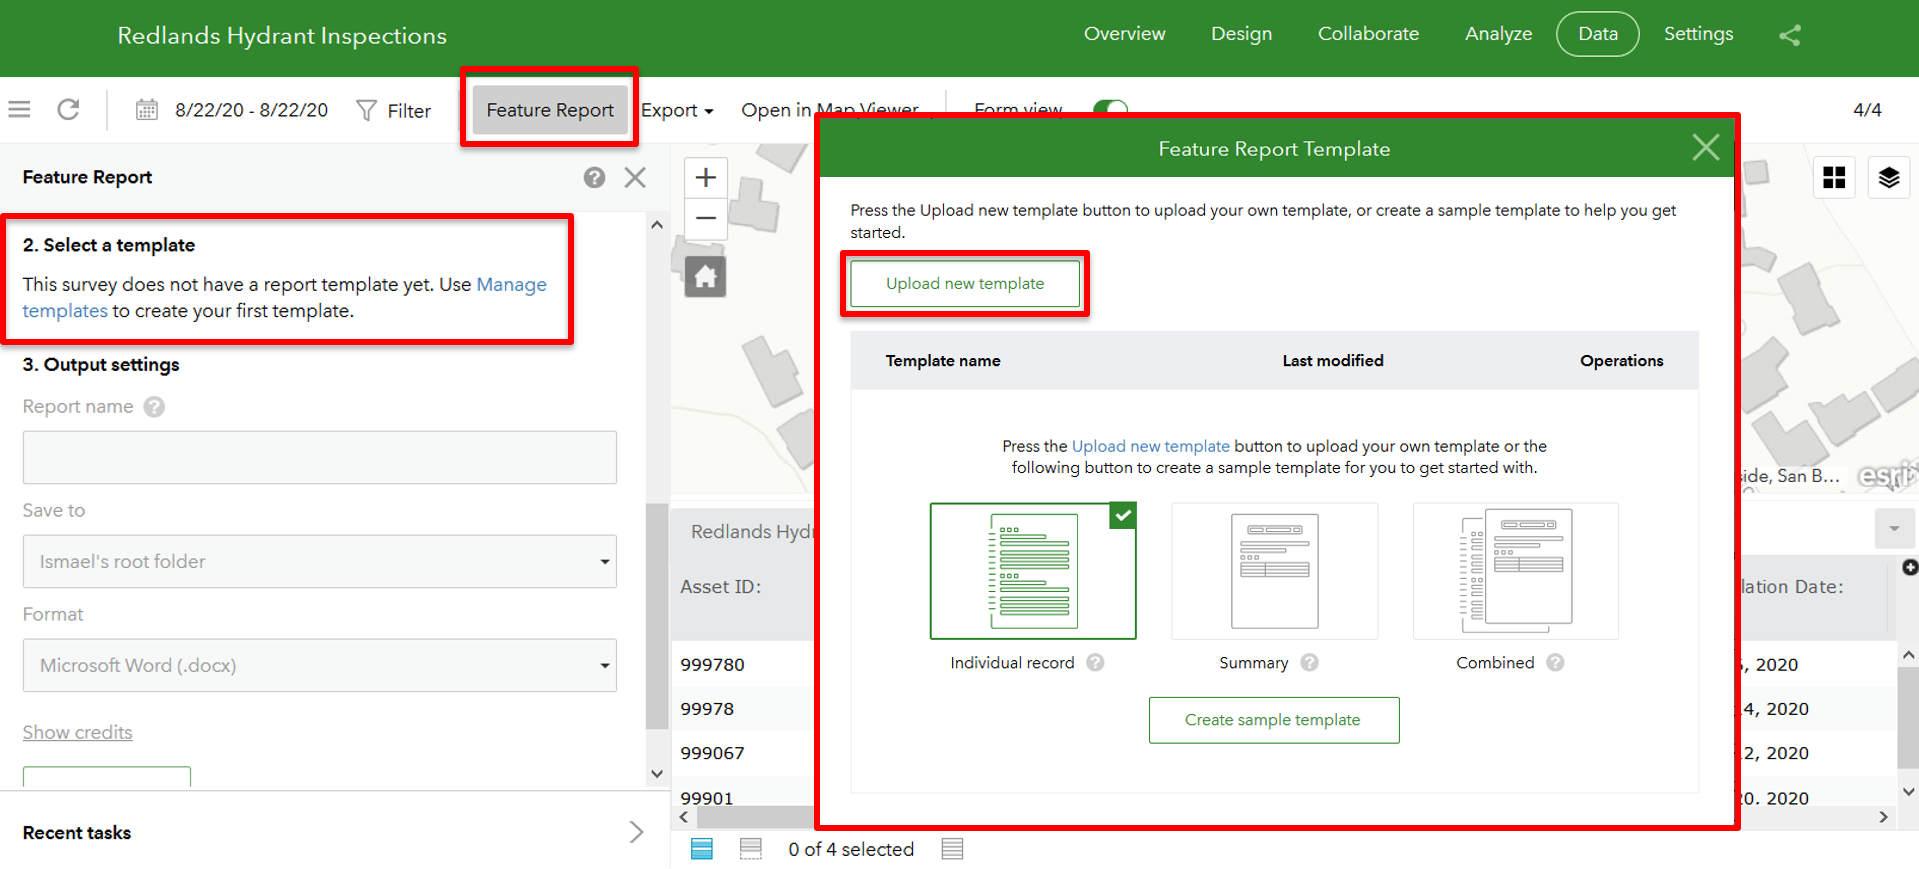
- Click on Upload new template.
- Browse for your report template and upload it.
- Next, select three of the hydrant records you created and generate a preview sample report:
- Select 3 records in the table
- In the side report panel, make sure the report is executed against the selected records only.
- In File options, select the option to merge into a single continuous document
- Select your template
- Click on the Preview sample report link
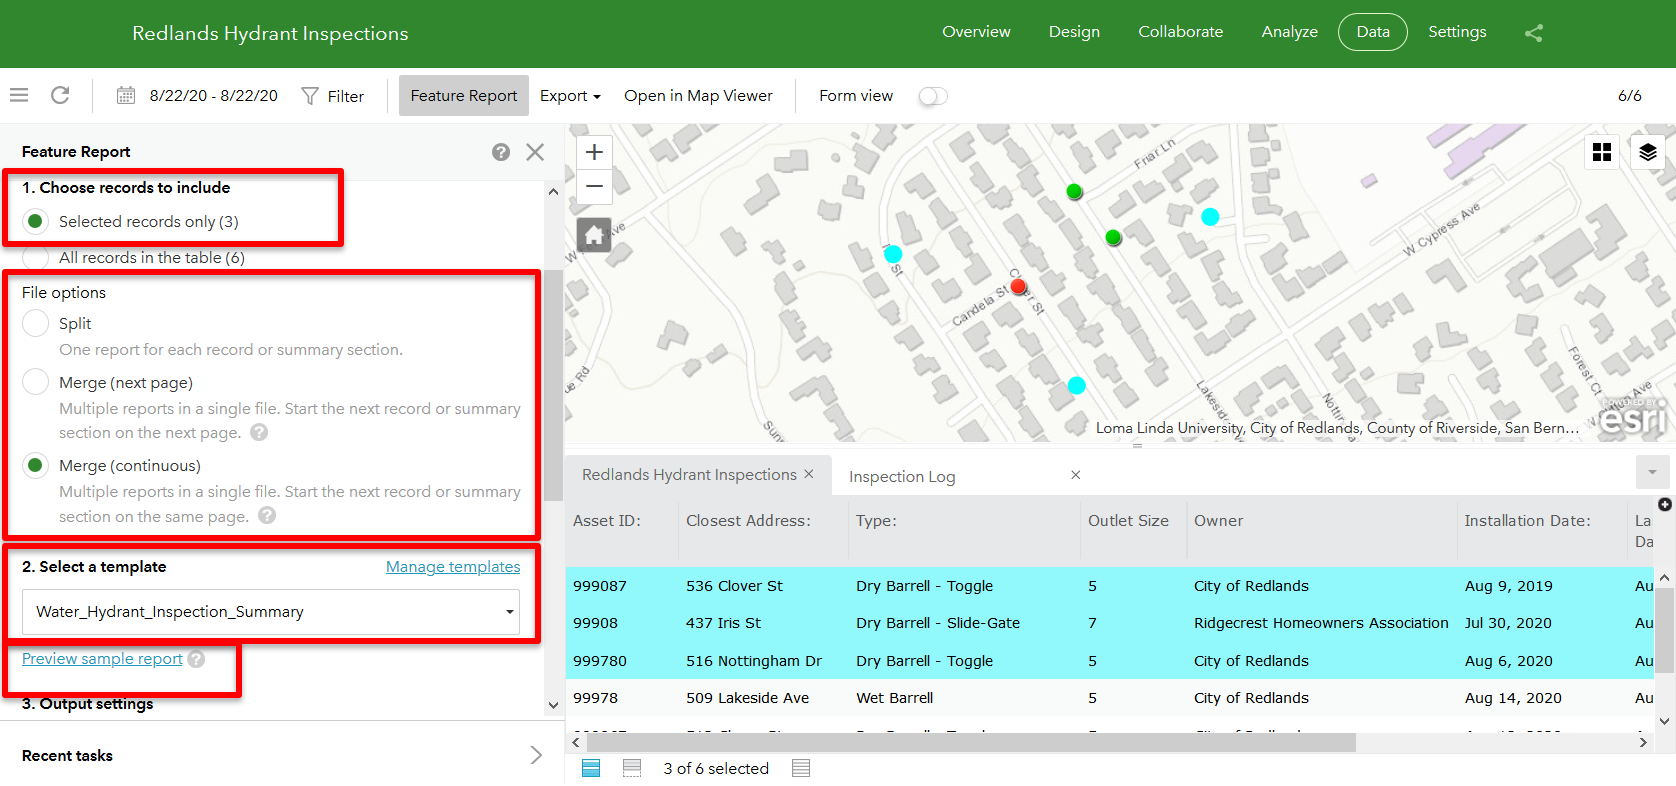
Your sample preview should look like this:
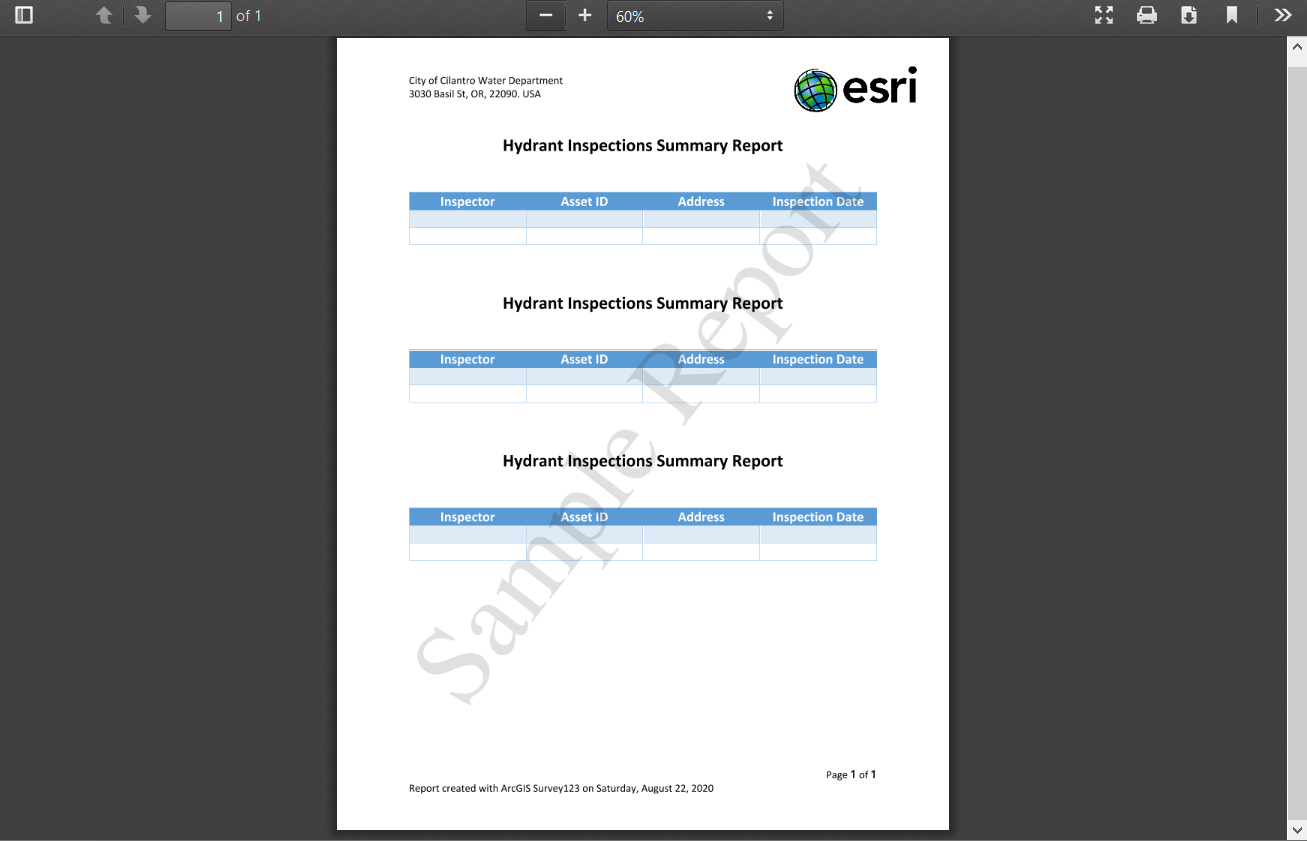
I bet the output is far from what you expected:
- Why the table is empty? The table shows no records because we did not add instructions in the report template to fetch data from your survey. We just added a title and an empty table in it.
- Why are the table and title repeated three times? The table is repeated because when you ask Survey123 to create a report for a selection of records, your report template is processed once for every record in your selection. Unless you enclose your template contents within a Survey123 summary section, this output is expected.
OK. So now let's add a summary section. A summary section is opened with $<$summary> and closed with $</>. Edit your template as shown below. Note that I highlighted the summary section tags in green. The formatting of the tags does not make any difference to the Survey123 report engine, but it can make your template more readable.
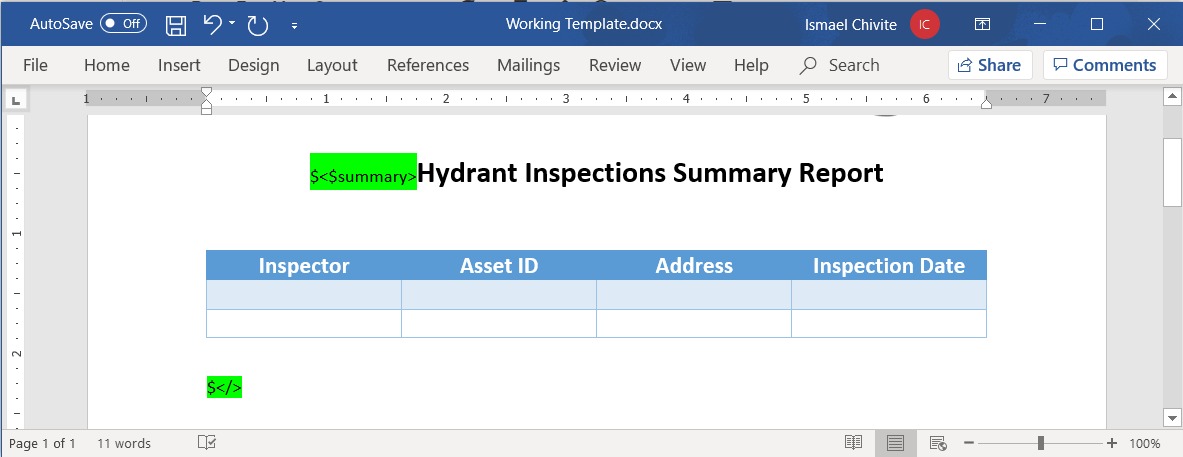
Note that the title is inside the summary section. As we just learned, contents outside of the summary section will be processed once for each selected record. We do not want multiple titles in our case, or multiple tables, so of these elements need to be placed inside the summary section.
Finally, note that I added the $<$summary> opening tag in the same line as my title. I did this on purpose, because I do not want to introduce an extra line in my output report. When the $<$summary> tag is on its own line, the line it occupies will not be removed in the output report. Sometimes you want to have $<$summary> in its own line, and sometimes you don't. It depends on what you want to do.
As we make changes in the report template, it is important to regularly upload it to the Survey123 website so we can check the syntax. Otherwise it can be challenging to figure out where exactly syntax errors happen.
- From the report panel on the right side, click the Manage templates link.
- Use the Edit icon in your template to upload your new version.
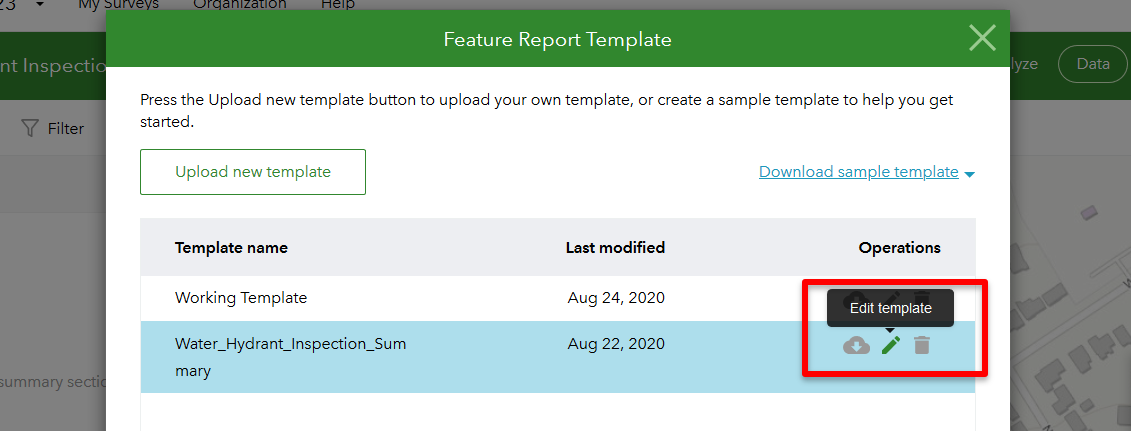
- With your 3 records selected, click on Preview sample report.
At this moment, since you have no contents in your report template outside the summary section, the output of your report request is a single report, in a single file, with a single title and table.
Populating our table
We need to add instructions within our table to fetch information from the selected set of records. To do this, we need to reference in our template the layer and fields from which we want to retrieve the data. Since we may not remember the exact name of layers and fields, we will use the reference table from the Upload new template dialog.
- From the report panel on the right side, click the Manage templates link.
- Use the Edit icon in your template.
- The Upload new template dialog shows the reference table at the bottom, as shown in the screenshot below.
We will use this reference table regularly, so keep this dialog open.
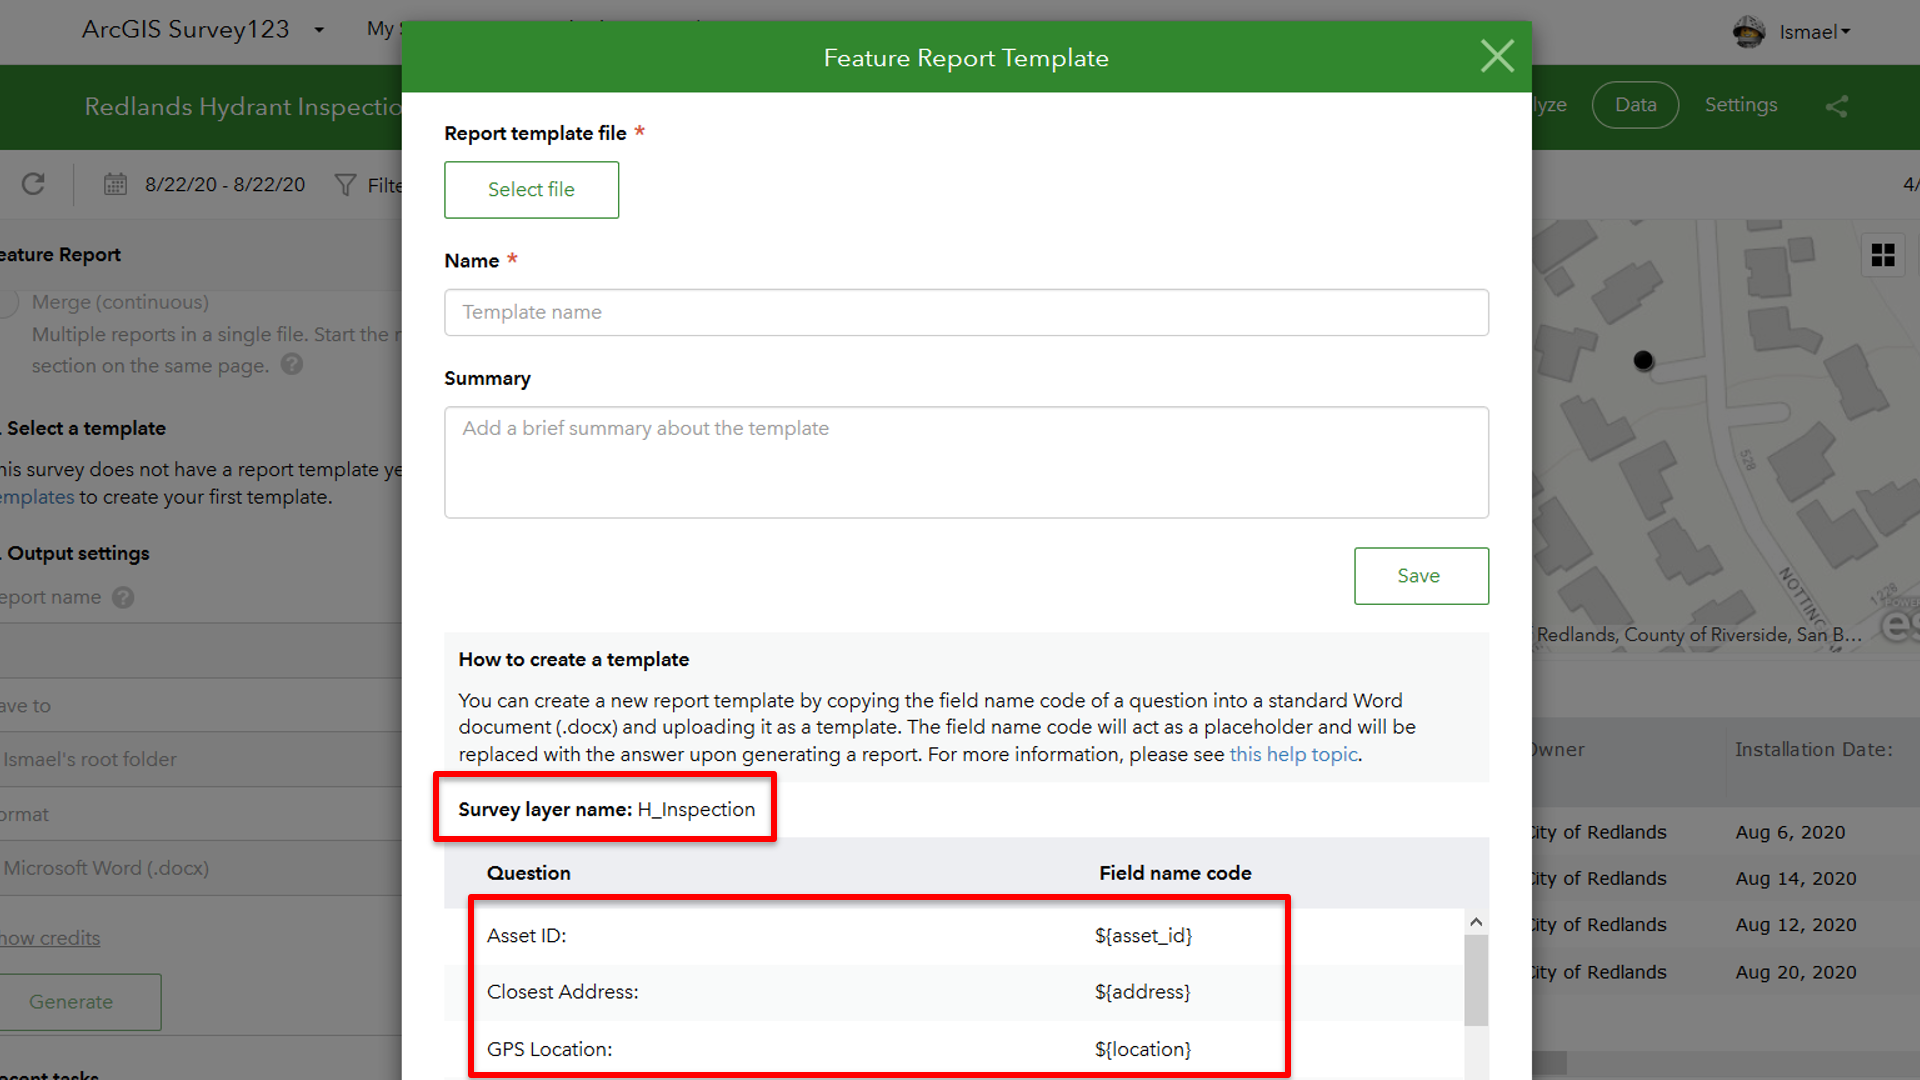
First, we will create what is known as repeat section. When a repeat section is encountered by the Survey123 report engine, all contents within the section are processed for every record referenced in the repeat. A repeat section is opened with ${#LayerName} and is closed with ${/}. As you can see in the screenshot below, the layer name needs to be replaced accordingly. You can get the layer name for your survey from the reference table in the Upload new template dialog. In the context of Survey123 report template syntax, the # sign in the opening tag is an indication that the section is a repeat.
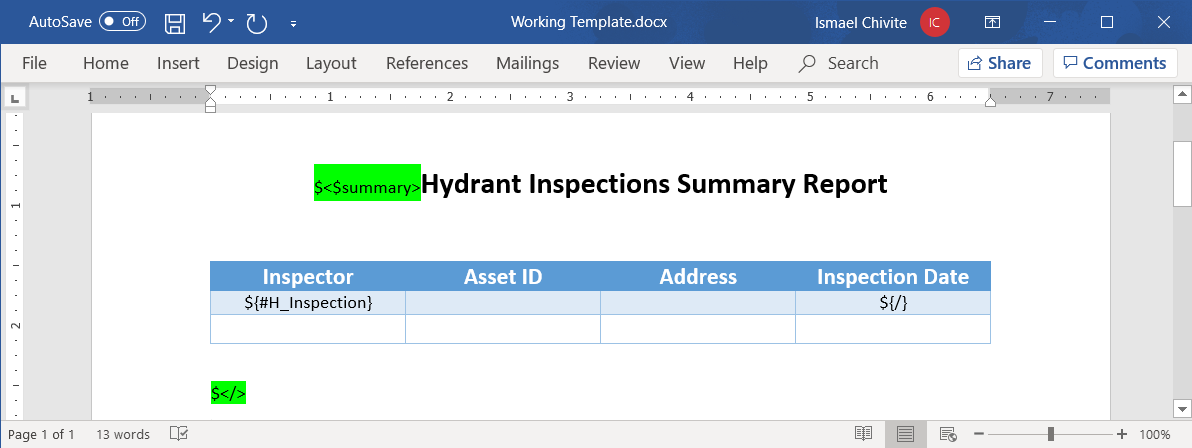
If you were to upload and run a report with the template above, new rows will be added to the table: one row per survey record. To complete the table, we need to make sure we have instructions to pull values from the corresponding fields. The table for our survey will look like this:
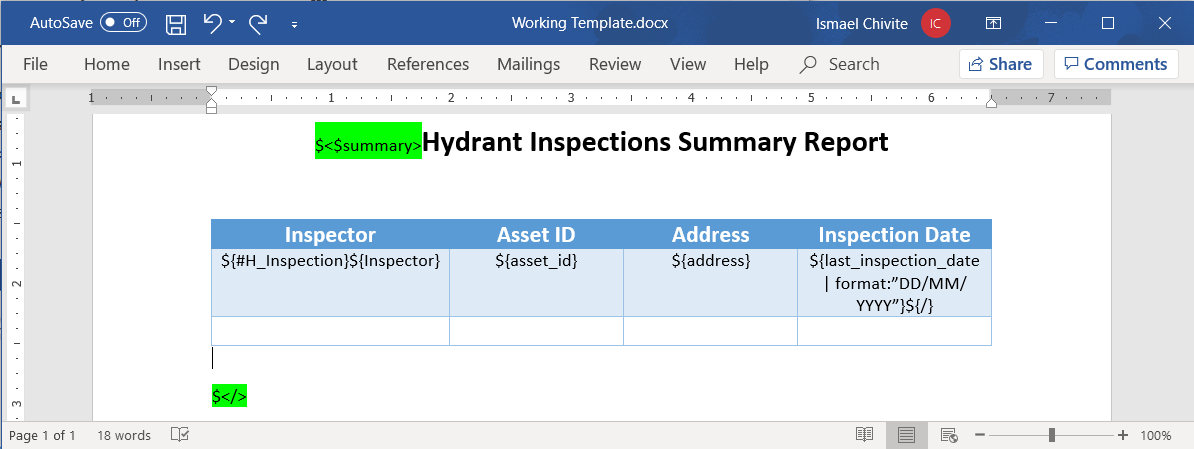
It is important to note that out of all the Survey123 report template syntax we have added in our table, some parts will not be included at all in the output, and others will be replaced with data.
- The repeat section opening and closing tags will not be included at all. This means that you can use whatever formatting you want in your design to make it more legible.
- The syntax to retrieve data from fields will be replaced with values from the records, so the formatting you apply to your report syntax matters. For example, if you insert an instruction like ${asset_id} setting the font color to blue, then the Asset ID will be rendered blue in the output report.
To be more exact, to define the formatting of your field values in the output report, you do not need to change the format for the entire Survey123 report template syntax. The only character that matters is the initial $ sign. This is important because sometimes the syntax can be long and interfere with your design. A good example is the Inspection Date in our sample. It uses three lines in the cell, affecting the height of the whole table in the design view. To avoid this, use a smaller font size for the expression and apply the font style you want for the Inspection Date to the $ sign only. Here is an example of a sample preview report with various formatting styles applied:
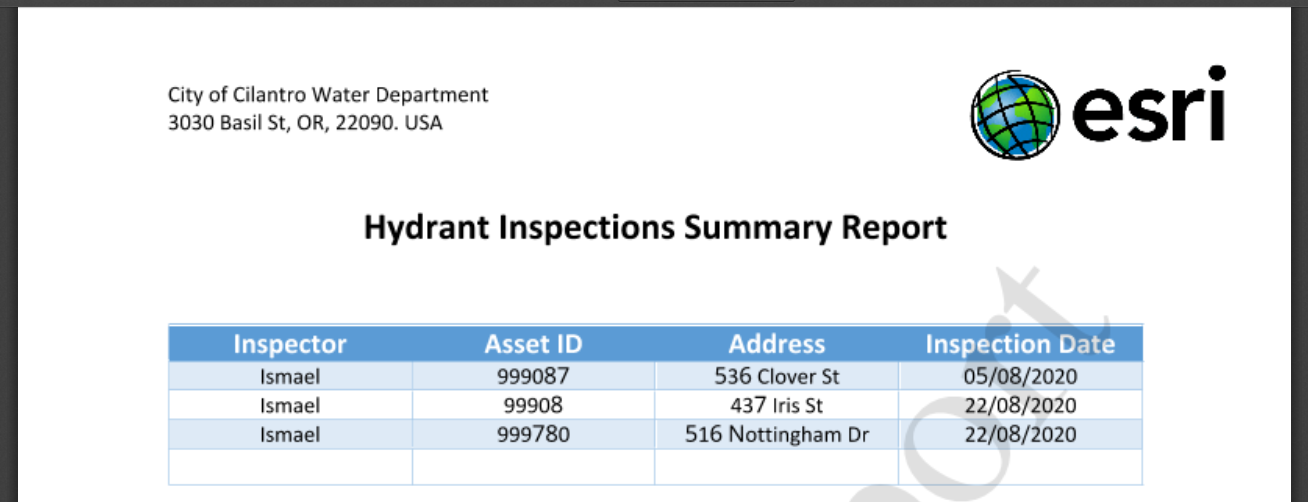
At the end of the table, you can see an empty white row. If you do not like that, go into you report template design and remove it from the table.
So far, we have explored how to insert a table into our report to display all the input records as rows. This is a basic, yet powerful technique that will help you model many reports you may be asked to build. Next, we will cover how to include multiple tables in a report and control the contents of these tables using filters.
Filtering and sorting report records
When defining your repeat section against the survey layer, you can use parameters to filter and sort records in your selection. For example:
${#H_Inspection | where: "last_status = 'needs_repair' " | orderByFields:"last_inspection_date DESC"}${/}
The where parameter filters the input selection from the report request. The orderByFields parameter is used to present rows sorted by inspection date in descending order. Using filters in this way, you can insert into your report multiple tables, each for the different conditions found in your data.
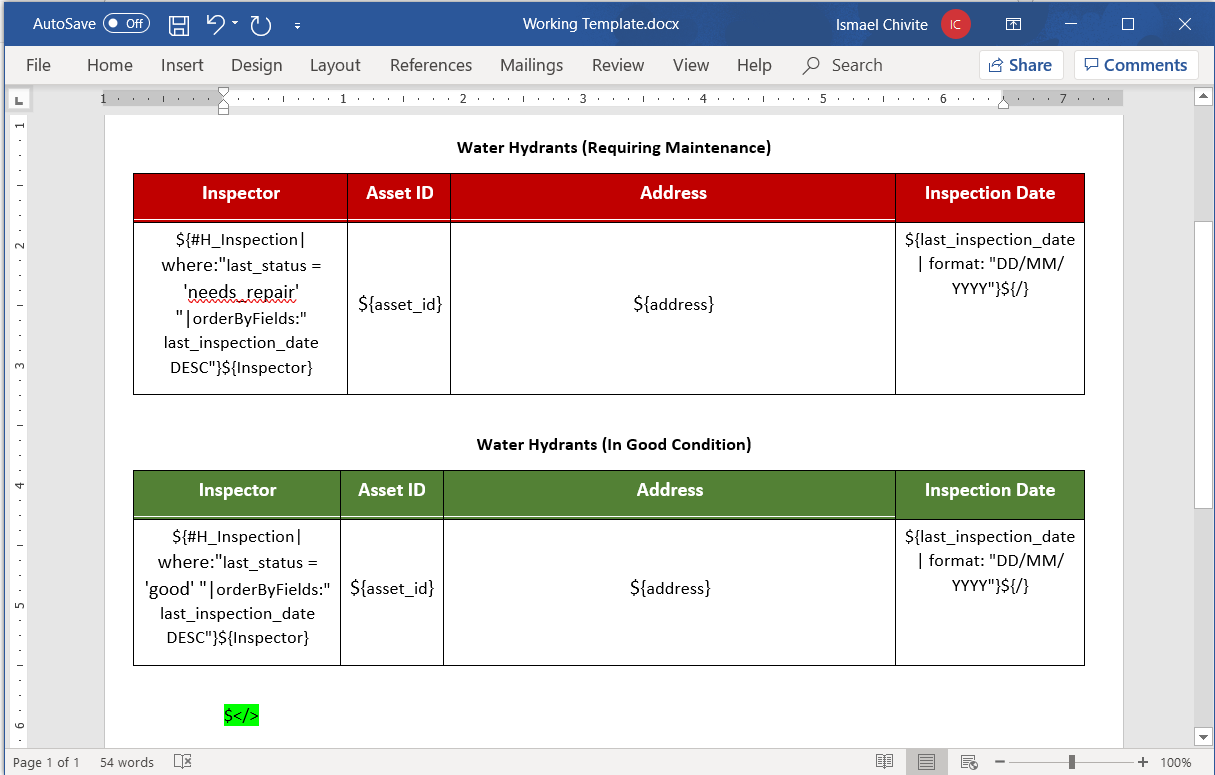
Filters in your report template apply to only the collection of records selected for the report. For example, if you use the Survey123 website to select 100 records out of 2000 and then request a your summary report, the filters within the template only apply to the 100 selected records.
Statistics
A summary report might also include statistics. For example, in our hydrants example we may want to present a total count of all hydrants inspected, or a table showing a count per status. The following expression returns the total count of records from the Redlands_Hydrants layer that have been submitted to the report.
${Redlands_Hydrants | stats:"count,objectid"}
This expression returns the total number of hydrants that need repair.
${Redlands_Hydrants | where:"last_status = 'needs_repair' " | stats:"count,objectid"}
To get the statistic, you need to pass the statistic you want (sum, max, min, count, avg) and also the field on which you want to calculate the statistic. Records with null values will be ignored.
Back to our template, we could do something like this:
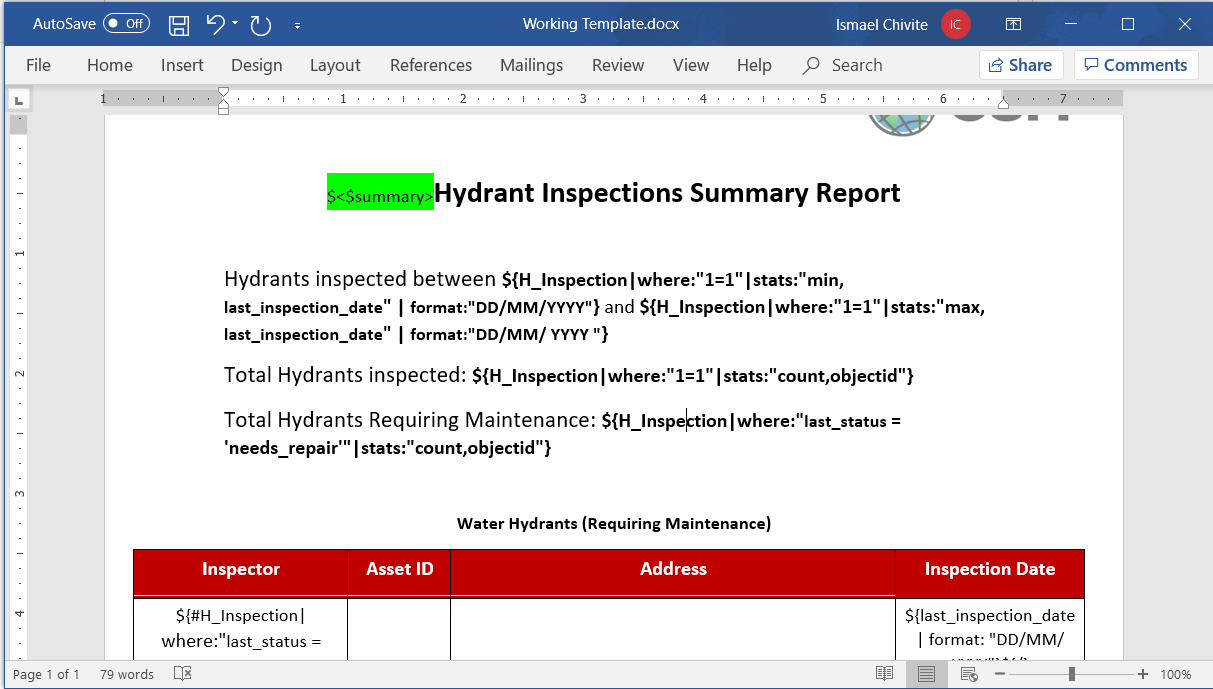
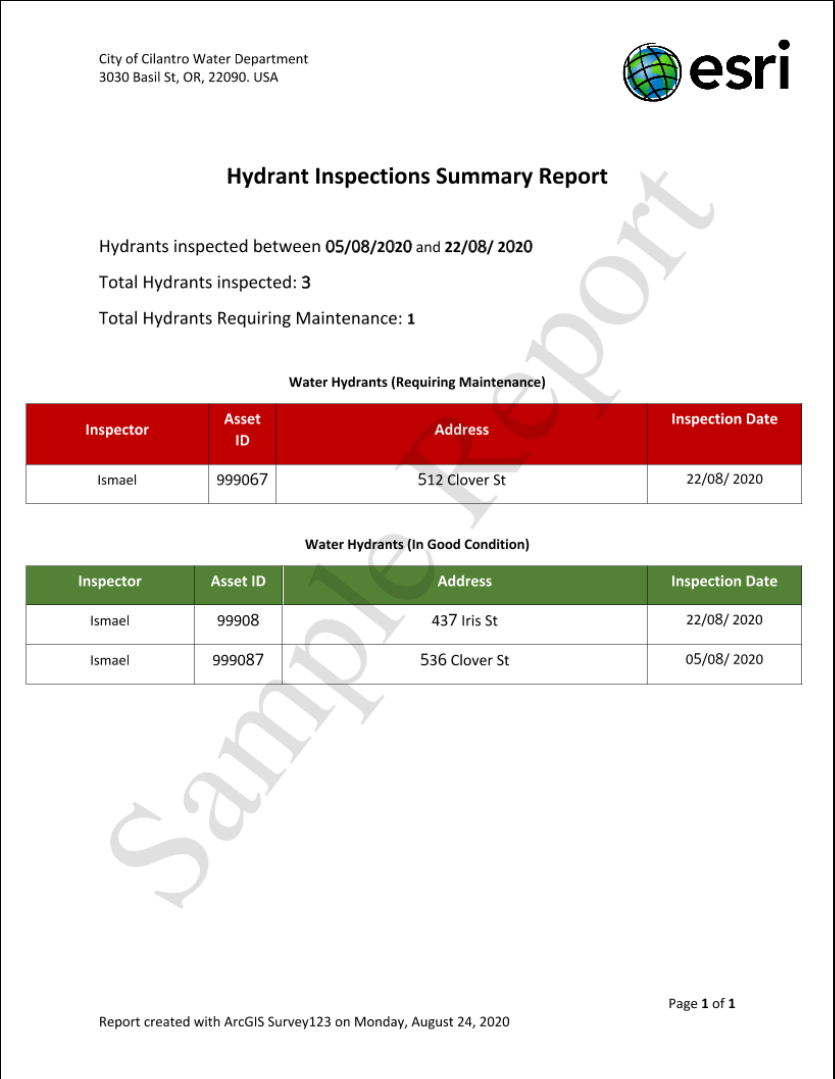
And here is what I get in the final report with a selection of 3 records. The report is now looking a lot more like the summary we set out to create!
!important
The expressions we have used so far to process records within the survey layer, or to extract statistics out of it, are limited in scope to the survey records selected for the report. By using the !important parameter, you can make the report engine work against all records in the layer you are referencing.
For example:
Retrieve the count of all hydrants in the Redlands_Hydrants layer that need repair:
${Redlands_Hydrants | where:"last_status = 'needs_repair' !important " | stats:"count,objectid"}
Retrieve the count of all the selected hydrants in the Redlands_Hydrants layer that need repair:
${Redlands_Hydrants | where:"last_status = 'needs_repair' " | stats:"count,objectid"}
Create a repeat block to process all hydrants in the Redlands_Hydrants layer that need repair:
${#Redlands_Hydrants| where:"last_status = 'needs_repair' !important "} ${/}
Limit the repeat block to selected hydrants that need repair:
${#Redlands_Hydrants | where:"last_status = 'needs_repair' "} ${/}
The !important modifier must be used in the context of a where statement. For example, if you want to get the total number of records in a layer, you cannot do this:
${Redlands_Hydrants | !important | stats:"count,objectid"}
You have to do this:
${Redlands_Hydrants | where:"1=1 !important " | stats:"count,objectid"}
Additionally, this is incorrect, because the !important parameter is left out of the where statement.
${Redlands_Hydrants | where:"1=1" !important | stats:"count,objectid"}
This is correct, because !important is enclosed by the closing quote of the where statement
${Redlands_Hydrants | where:"1=1 !important " | stats:"count,objectid"}
An important (no pun intended) note when using !important in a repeat section is that the number of records retrieved will be limited by the maxRecordCount property in your target feature layer. Say, for example, you have 3,000 hydrants and you use !important to create a table with all 3,000 records. You will find that only the first 1,000 will be shown in the table, because the default maxRecordCount is generally set to 1,000. If you want to alter the maxRecordCount property refer to How To: Update the maximum record count for feature services in ArcGIS Online
The maxRecordCount threshold does not affect statistics. For example, if you use !important to do a count of all hydrants, you will get the correct number.
Group By Summary Tables
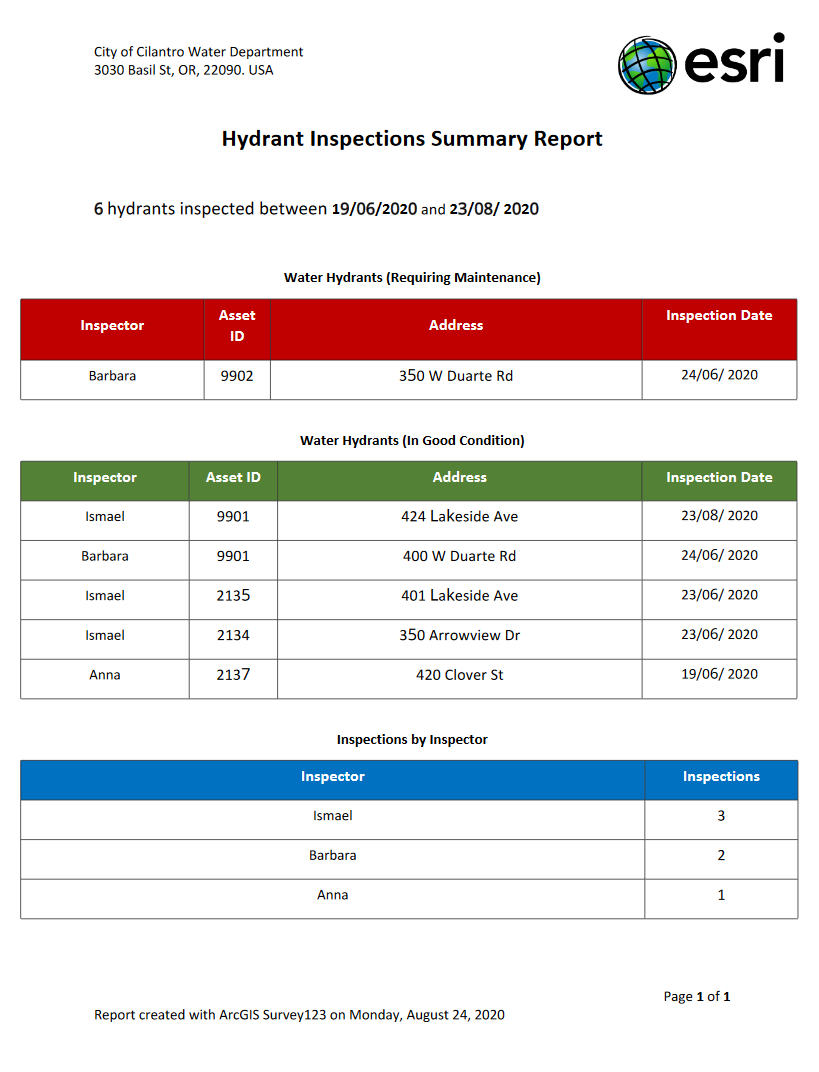
Sometimes, you may want to include in your report a table that groups a statistic for your records. In our hydrant report sample, we may want to include a table to show how many inspections (count statistic) were performed by each inspector (grouped by inspector). In SQL jargon, this would be possible with a GROUP BY query.
This can be accomplished by adding a repeat section, with a filter that includes a GROUP BY. Here is what the syntax would look like for the hydrant report:
| Inspector | Inspections performed |
|---|---|
| ${#H_Inspection | stats:"count,objectid,inspectionCount":"Inspector": "" | where:"1=1" | orderByFields:"Inspector DESC" }${Inspector} | ${inspectionCount}${/} |
A screenshot of the resulting report is below. The blue table at the bottom shows the inspections by inspector. The complete reference for these types of filters can be found in Feature report queries—ArcGIS Survey123 | Documentation
Other considerations and tips
No images or maps within a summary section
Summary sections have some limitations. You cannot include a map or a photo within a summary section. If you want to include maps or images in your report, just make sure you reference them from outside the summary section.
'Straighten' your quotes
A mix of straight (" ") and cursive (“ ”) quotes in your Survey123 report template syntax can generate syntax validation and/or execution errors. For consistency, I personally like to use always straight quotes: (") for double quotes and (') for single quotes. Microsoft Word tends to replace straight quotes with cursive (also known as smart quotes), but you can change this behavior as described at Smart quotes in Word - Word
Embed Fonts in Microsoft Word report template (if needed)
If the output PDF files generated by your template do not show fonts the way you expect them, embed fonts in your template as described at Embed fonts in documents or presentations - Office Support
Pricing
If your survey is hosted in ArcGIS Enterprise, you can create as many reports as you like for free. If your survey is hosted in ArcGIS Online, your reports will consume credits. Here is how credits are calculated:
- If your survey includes all Survey123 syntax within a summary section, the cost is 0.5 credits for the entire report. It does not matter how many records are included in your summary section.
- If your report does not have a summary section, or you use Survey123 syntax outside a summary section, the cost of the report in credits is the result of multiplying the number of selected records you are including in the report by 0.5.
Get Creative (Cover pages and more)
The focus focus of this blog has been to show how summary sections can be used to embed tables within your report. You can, however, use summary section in more creative ways. As we saw earlier on, the contents of a summary section are only processed once during a report request. For this reason, they also make a good candidate for you to create a cover letter for a report where you want to include multiple merged individual reports.
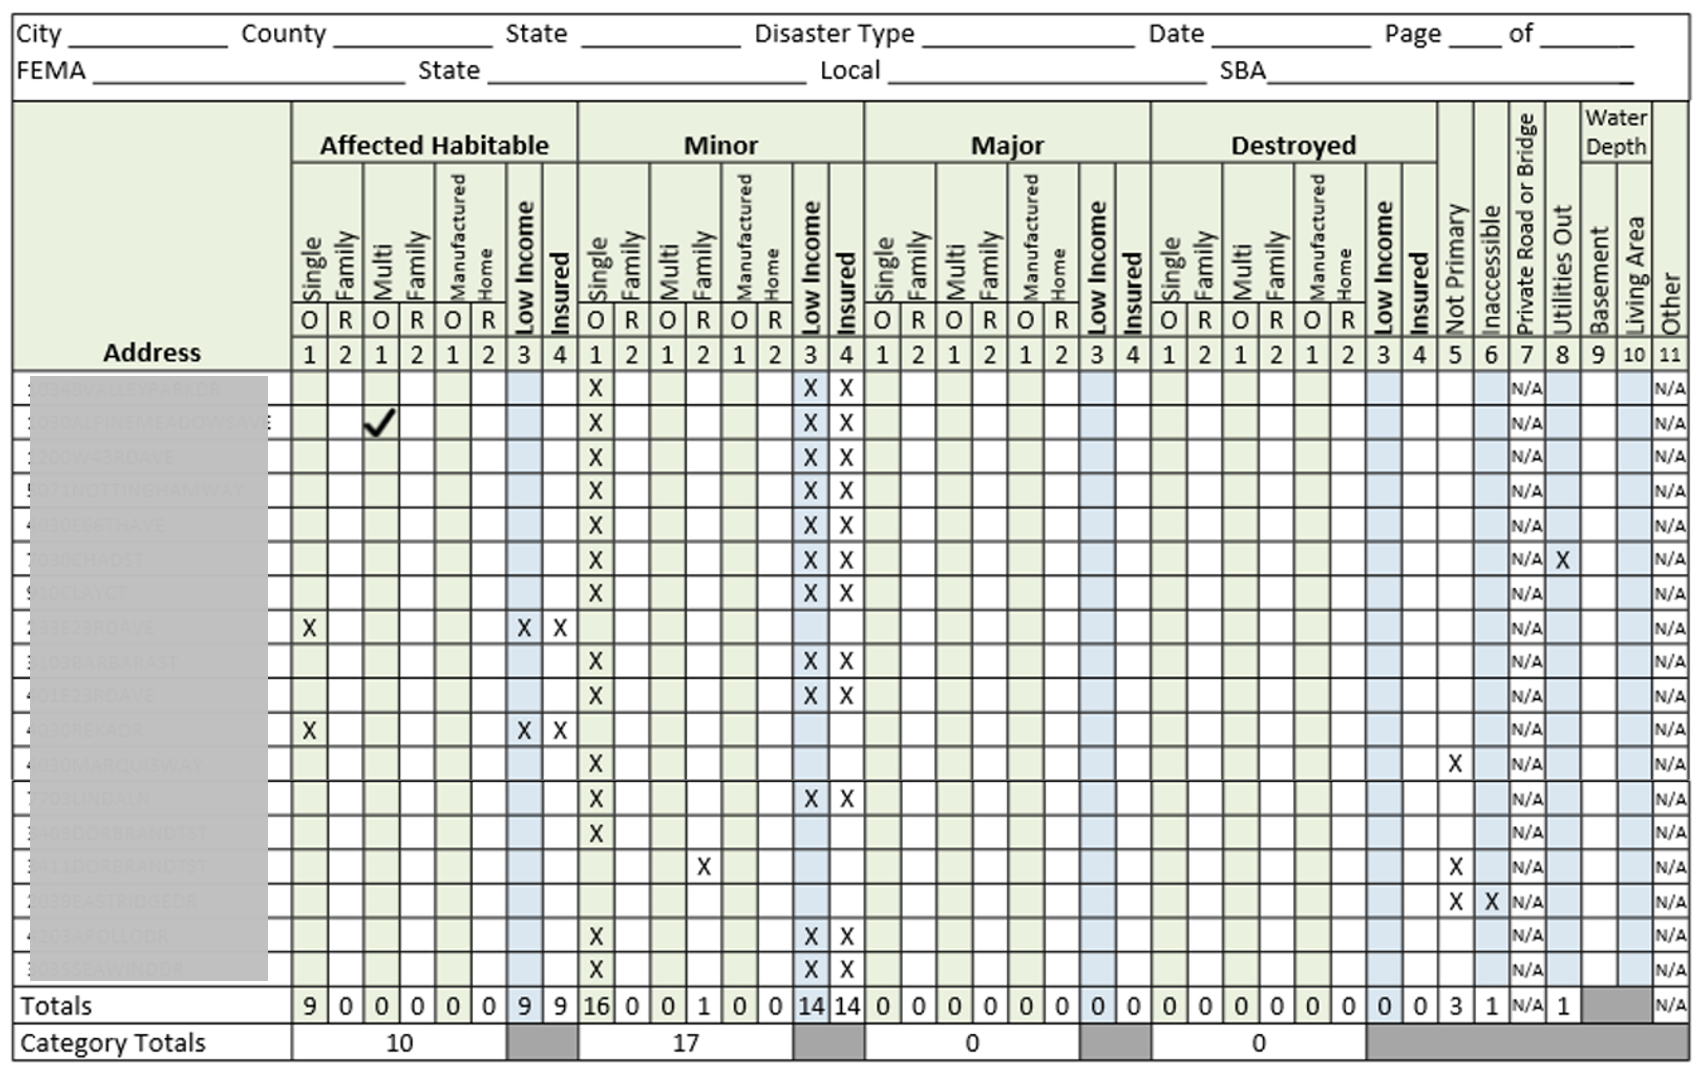
The Damage Assessment Summary report below also shows a creative use of a summary section. The report shows a list of addresses, which has been obscured on purpose in the screenshot. The grid uses check-marks to indicate the type of property and the severity of damage. This report template uses conditional statements extensively to evaluate if a particular cell must be checked or not. At the very bottom of the report you can also see totals and category totals. These values are all extracted using statistical functions described in this blog and the Survey123 documentation.
You must be a registered user to add a comment. If you've already registered, sign in. Otherwise, register and sign in.