- Home
- :
- All Communities
- :
- Products
- :
- ArcGIS Pro
- :
- ArcGIS Pro Questions
- :
- Re: What is wrong with my Contours? I'm using ArcG...
- Subscribe to RSS Feed
- Mark Topic as New
- Mark Topic as Read
- Float this Topic for Current User
- Bookmark
- Subscribe
- Mute
- Printer Friendly Page
What is wrong with my Contours? I'm using ArcGIS Pro
- Mark as New
- Bookmark
- Subscribe
- Mute
- Subscribe to RSS Feed
- Permalink
What is wrong with my Contours? I'm using ArcGIS Pro
I want my contours to look like Topo Lines on a topo map.
But these lines are not looking correct, I think it is a setting that I need to change, such as "contour interval" perhaps.
Solved! Go to Solution.
Accepted Solutions
- Mark as New
- Bookmark
- Subscribe
- Mute
- Subscribe to RSS Feed
- Permalink
You will need to add the State of Hawaii's server to your project. To do that in ArcGIS Pro, go to the Insert tab, under Connections, and choose Server --> New ArcGIS Server:

For the server URL, put in https://geodata.hawaii.gov/arcgis/rest/services and then hit OK.
After that, you can add data straight from the State's server.
Go to Add Data --> Data --> Servers and choose the Hawaii server.

To find the dataset I was using, it's in SoH_Imagery --> Hawaii_DTM_elevation --> Maui_DTM.
Feel free to browse through the other datasets to see if they might work better.
- Mark as New
- Bookmark
- Subscribe
- Mute
- Subscribe to RSS Feed
- Permalink
That was the ticket, the "add Hawaii server" did the trick. Now I can get proper contours. Thank you so much, you have no idea how many hours I have wasted trying to figure this out.
- Mark as New
- Bookmark
- Subscribe
- Mute
- Subscribe to RSS Feed
- Permalink
What is the minimum and maximum elevation in your area?
Did you try a different contour interval?
... sort of retired...
- Mark as New
- Bookmark
- Subscribe
- Mute
- Subscribe to RSS Feed
- Permalink
Sea level to about 300 ft, I have tried different contour intervals, but the output seems to show the variations from the ground level (gullies and gulches and knolls), not contour lines of elevation above sea level.
- Mark as New
- Bookmark
- Subscribe
- Mute
- Subscribe to RSS Feed
- Permalink
That doesn't look like a dem with a 300 ft elevation difference, are you sure it isn't some other terrain derivative?. You might want to reload/download the original dem and symbolize it with a color ramp so people can see what it looks like
... sort of retired...
- Mark as New
- Bookmark
- Subscribe
- Mute
- Subscribe to RSS Feed
- Permalink
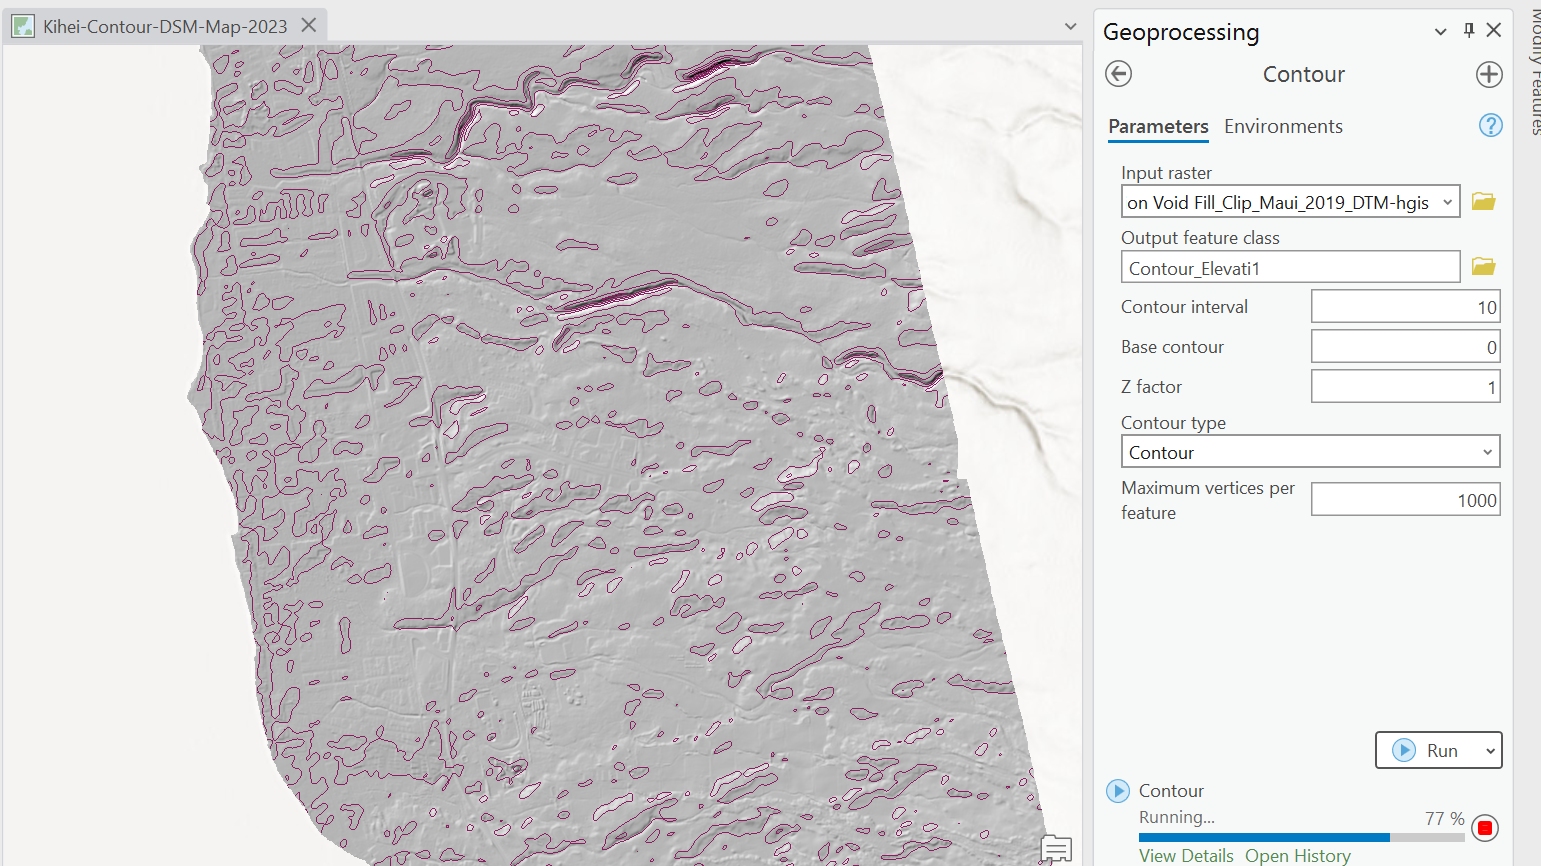
I am trying to use this: https://geoportal.hawaii.gov/datasets/HiStateGIS::maui-2019-dtm-elevation/about to create topo/contour lines with better resolution than 100ft. Here is a screenshot of what I got, and the settings I used.
- Mark as New
- Bookmark
- Subscribe
- Mute
- Subscribe to RSS Feed
- Permalink
This method worked great for me. Hope it helps.


- Mark as New
- Bookmark
- Subscribe
- Mute
- Subscribe to RSS Feed
- Permalink
I agree with changing the contour interval but one thing to consider on top of that is what your coordinate system units of measure is in. If you are in meters and try doing a contour interval of 10 (thinking it is feet), it will look vastly different.
I often come across this problem since the data I normally receive is in meters and people want contours in feet. So I normally run a contour interval of 0.3048 (since 0.3048 meters is 1 foot) and then add a new field and convert that value back to feet values. It's a bit tedious but it could explain why the contours look so spread out.
- Mark as New
- Bookmark
- Subscribe
- Mute
- Subscribe to RSS Feed
- Permalink
Ok, thanks for sharing the data source. This is what I think is happening (but I may be wrong). These files you are downloading are not actually DTMs or DSMs. They are images of these models. You can tell since all the pixel values fall between 0 and 255 meaning that they follow the RGB pattern. This is why you are getting weird results with your contour lines. The actual DTM will have a value range of -1 to about 1700. None of the downloadable files show this data (they are all either jpg, png, or tiff and are all truly just images).
This is likely not the answer you are looking for but that particular dataset was not rendered for GIS use - just visual purposes. Your next best bet is to either use the USGS 10 meter DEM of the entire area (found within their rest services) or I found another Maui DTM (1 meter) within their rest services that is a true DTM of most of the island with a range of values from 2241 to -60:

In order to find that, you need to connect to the state of Hawaii ArcGIS server and browse through their image server. I hope this is closer to what you're looking for! (I cannot give a direct link to this image service but can perhaps provide a connection file).
- Mark as New
- Bookmark
- Subscribe
- Mute
- Subscribe to RSS Feed
- Permalink
I have been using the "Maui DTM" from Hawaii GIS and ArcGIS portal. Example, https://geoportal.hawaii.gov/datasets/HiStateGIS::maui-2019-dtm-1/
But these don't seem to work for me (they all seem to have 0-255 ranges). Which one was the one that you showed the screenshot of?