- Home
- :
- All Communities
- :
- Products
- :
- ArcGIS Insights
- :
- ArcGIS Insights Questions
- :
- For Chart category, can't change font size, screen...
- Subscribe to RSS Feed
- Mark Topic as New
- Mark Topic as Read
- Float this Topic for Current User
- Bookmark
- Subscribe
- Mute
- Printer Friendly Page
For Chart category, can't change font size, screen reader Narrator or JAWS can't read them.
- Mark as New
- Bookmark
- Subscribe
- Mute
- Subscribe to RSS Feed
- Permalink
- Report Inappropriate Content
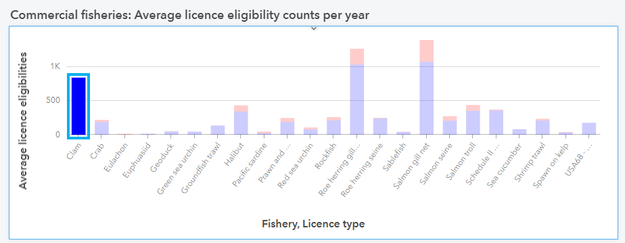
Developed with Insights Enterprise v2023.2, for the categories in following chart, any way to change the font size?
Based on the official documentation, it is accessible but tried both screen reader Narrator and JAWS none of them can read out the categories.
https://doc.arcgis.com/en/insights/latest/get-started/keyboard-shortcuts.htm
Thanks for any help!
Solved! Go to Solution.
Accepted Solutions
- Mark as New
- Bookmark
- Subscribe
- Mute
- Subscribe to RSS Feed
- Permalink
- Report Inappropriate Content
@Ming From the information I got, this is handled by the charting library we use. So apparently 20 seems to be a limit but I couldn't find that in the documentation. Unfortunately, this doesn't help you much but it is something out of our control as well.
Akshay Harshe
- Mark as New
- Bookmark
- Subscribe
- Mute
- Subscribe to RSS Feed
- Permalink
- Report Inappropriate Content
@Ming Thanks for the question. Unfortunately, there isn't a way to change the font on categories.
I was able to use Windows Narrator successfully on a Stacked bar chart using Win10 & Google Chrome. you want to use keyboard navigation ("Tab") button to navigate to a category and highlight. Let me know what browser and OS you are using and I can see if there is an issue.
Akshay Harshe
- Mark as New
- Bookmark
- Subscribe
- Mute
- Subscribe to RSS Feed
- Permalink
- Report Inappropriate Content
Hi @AkshayHarshe,
Thank you very much for the response. I am also using Win10 & Google Chrome, but the Narrator reads all the chart as "Heading level one" not the category name like the select bar that should be read out as "Clam".
Ming
- Mark as New
- Bookmark
- Subscribe
- Mute
- Subscribe to RSS Feed
- Permalink
- Report Inappropriate Content
@Ming I don't hear that, For me it says the Category name. e.g. In my example, it says "<#> Wednesday Menu item"
I am using a newer update to Windows that yours, Maybe Narrator has some updates? See if you can download updates online.
This is my Chrome version
Let me know.
Akshay Harshe
- Mark as New
- Bookmark
- Subscribe
- Mute
- Subscribe to RSS Feed
- Permalink
- Report Inappropriate Content
Thank you @AkshayHarshe,
Can you please try following one that I used to test?
https://insights.arcgis.com/#/view/5e1de41b1869414a95f38c4aeb96dd03
Then we can confirm it is caused by my OS/Chrome version or chart settings.
Thanks,
Ming
- Mark as New
- Bookmark
- Subscribe
- Mute
- Subscribe to RSS Feed
- Permalink
- Report Inappropriate Content
@Ming Not sure what is going on with the page you shared, I can't even tab to the category Like I was able to in mine, Here is something I created https://insights.arcgis.com/#/view/7b1cf10f582e4b38ab19bf22bb3fd238
See if you can navigate to the column and hear correctly.
Let me know the following e.g.
- what is the data source used? (Feature service/ excel/ one drive etc.)
- What tools you have executed? (I see that in the model and I tried recreating something similar)
- When was the workbook created?
- It is possible if the workbook was created before we fixed some things then it could explain the difference. Also, try using a new workbook.
Akshay Harshe
- Mark as New
- Bookmark
- Subscribe
- Mute
- Subscribe to RSS Feed
- Permalink
- Report Inappropriate Content
Thank you @AkshayHarshe
The data source is csv. I did more test, looks it is related to the category count.
This one has 16 categories, it can read out category names:
https://insights.arcgis.com/#/view/03f1ae8120df4615b41c4998327692a8
This one has 23 categories, then can't read out category names:
https://insights.arcgis.com/#/view/e44a70dfc3a04d47a086aeafa6dd3508
Same data source, same environment, same operation.
Maybe the threshold of the category count is 20?
I will also do further test.
Thanks,
Ming
- Mark as New
- Bookmark
- Subscribe
- Mute
- Subscribe to RSS Feed
- Permalink
- Report Inappropriate Content
@Ming I appreciate you doing the testing and narrowing it down! I can reproduce this.
I am not familiar with VPAT support but it seems like this could be by design and if the number of categories exceeds a certain number then it skips the narration. This is probably to avoid getting stuck on the card for a long time. It also happens to Scatterplots.
When I navigate to the Stack chart narrator does say "<chart type> chart, visual aid required".
I will confirm with someone on our team.
Akshay Harshe
- Mark as New
- Bookmark
- Subscribe
- Mute
- Subscribe to RSS Feed
- Permalink
- Report Inappropriate Content
Hi @AkshayHarshe,
Just follow up, any update on this problem? Thanks.
- Mark as New
- Bookmark
- Subscribe
- Mute
- Subscribe to RSS Feed
- Permalink
- Report Inappropriate Content
@Ming From the information I got, this is handled by the charting library we use. So apparently 20 seems to be a limit but I couldn't find that in the documentation. Unfortunately, this doesn't help you much but it is something out of our control as well.
Akshay Harshe


