- Home
- :
- All Communities
- :
- Products
- :
- ArcGIS Insights
- :
- ArcGIS Insights Questions
- :
- coefficient of dispersion and other stats
- Subscribe to RSS Feed
- Mark Topic as New
- Mark Topic as Read
- Float this Topic for Current User
- Bookmark
- Subscribe
- Mute
- Printer Friendly Page
coefficient of dispersion and other stats
- Mark as New
- Bookmark
- Subscribe
- Mute
- Subscribe to RSS Feed
- Permalink
- Report Inappropriate Content
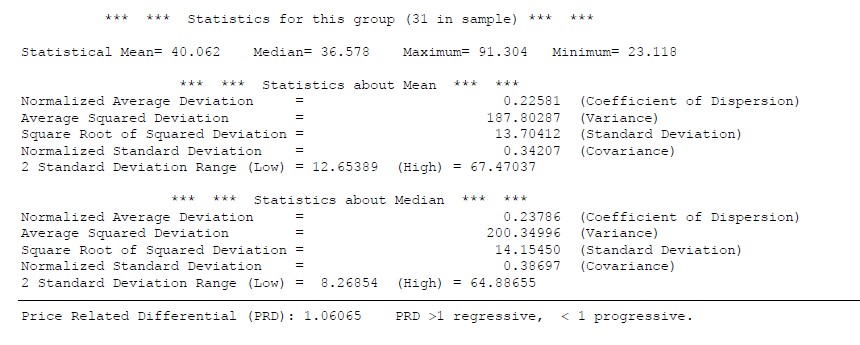
I have an insights workbook and I would like to display some stats in different cards like coefficient of dispersion and others like in the attached screenshot. I am pretty new to Insights, so I'm still trying to figure out how to use it. I do know the formulas for most of these stats, and the basic ones like average and median are in separate cards, I know a couple of these can be done with the regression model chart, but not all of them. Any help would be greatly appreciated.
- Mark as New
- Bookmark
- Subscribe
- Mute
- Subscribe to RSS Feed
- Permalink
- Report Inappropriate Content
You ae right, in Insights, many of these statistics are behind each card which your viewers can visualize. If you run a regression model and predict variables then the regression model will have some statistics in its data table.

The predicted variable should include the predicted fields and residual value etc. You can open this dataset to check out their formulas


We mostly have the statistics related to the analysis displayed in the application and some of the other measures you may want to calculate on your own.
If you are using ArcGIS Insights desktop or Enterprise deployment you can choose to create these statistics by using data added in insights with Python & R module. You can then add them as a screenshot into the analysis.
Hope this helps.
Akshay Harshe