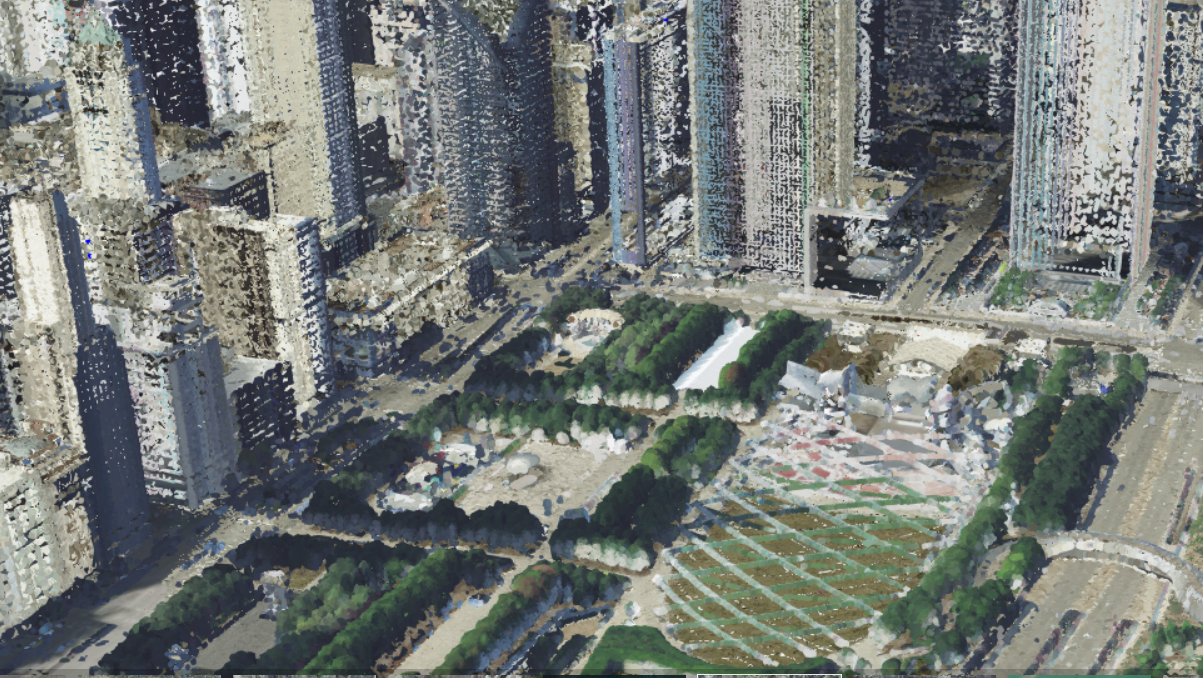
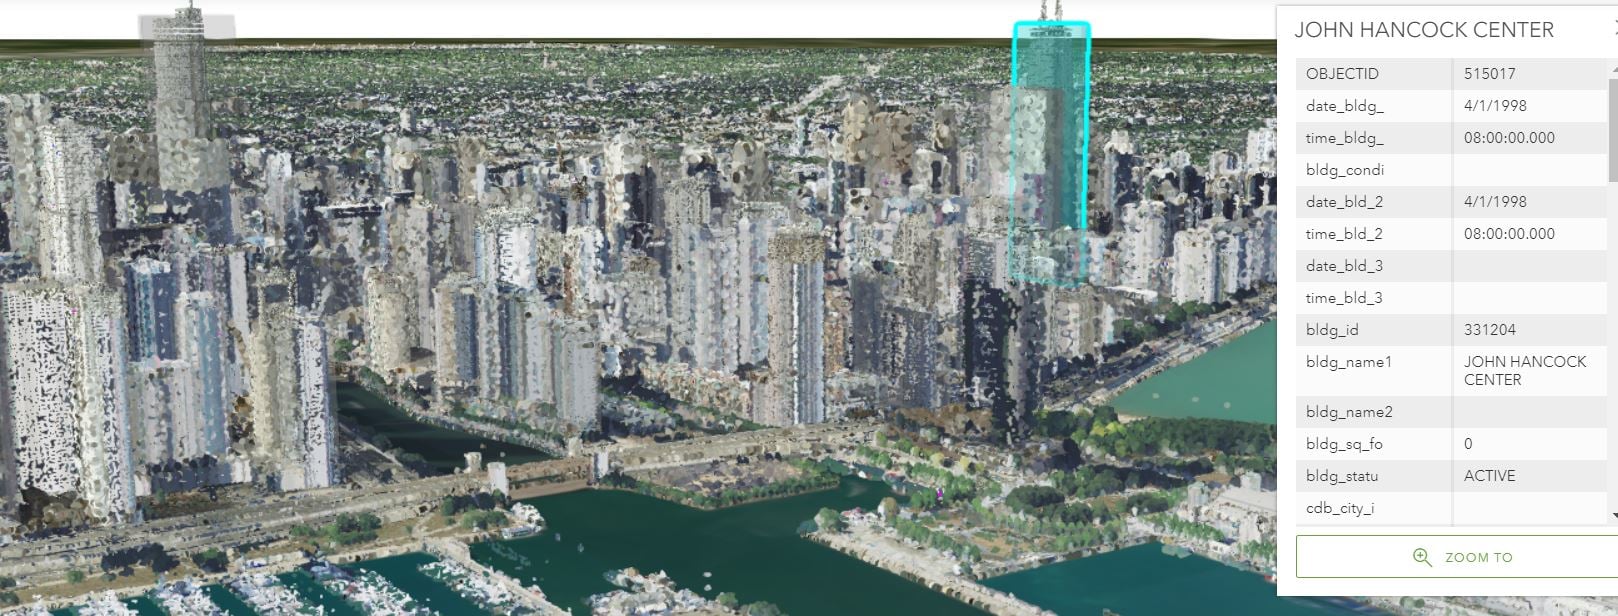
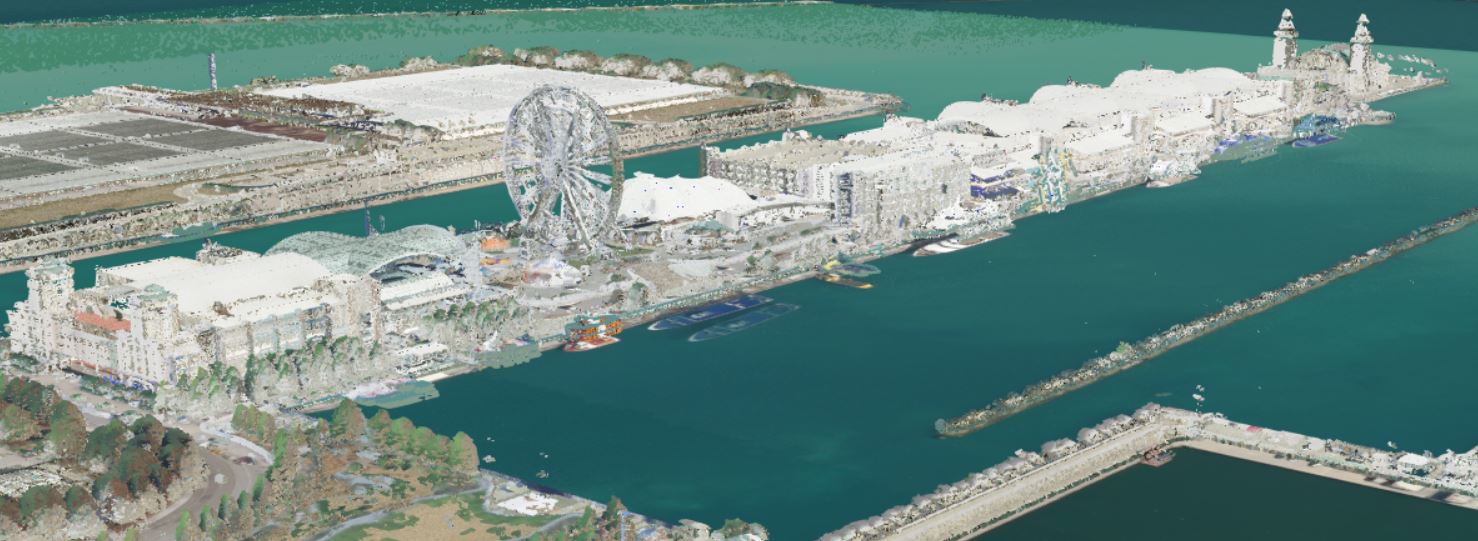
Este blog está em desenvolvimento, apenas começando e crescerá com o tempo:<\/STRONG><\/P><\/P>Nos últimos anos, tenho publicado nuvens de pontos lidar colorizadas como complementos para as cidades 3D, como a área de St. Louis<\/A>, que criei usando a solução 3D Basemap e extraindo edifícios do lidar. Sean Morrish escreveu um maravilhoso blog<\/A> sobre a mecânica da publicação de lidar. Ultimamente, tenho pesquisado o uso das nuvens de pontos lidar colorizadas como uma forma eficaz e relativamente barata de criar 3D Basemaps. Tem algumas vantagens, pois a maioria dos estados, condados e cidades já possuem lidar disponível, a maioria tem imagens de alta resolução e todos têm imagens NAIP necessárias para criar essas cenas. <\/P><\/P>Cenas lidar do Condado de Mantiowoc:<\/STRONG><\/P>Alguns condados, cidades e estados já estão fazendo isso. O Condado de Manitowoc, WI., tem uma Nuvem de Pontos LiDAR 3D<\/A> e também cria cenas<\/A> com os dados. O Condado de Manitowoc também fez um ótimo story map mostrando como seu lidar é usado como uma nuvem de pontos lidar colorizada <\/SPAN>aqui<\/A> e recomendo muito dar uma olhada nele. <\/SPAN><\/P><\/A><\/P>O StoryMap mostra com um vídeo como capturar distâncias verticais, horizontais e diretas das superfícies do solo LiDAR em qualquer local do condado. Como obter medições detalhadas de pequenas características da superfície LiDAR, como a profundidade de valas até a estrada. <\/P><\/P>Meça distâncias nas nuvens de pontos LiDAR em relação às superfícies do solo LiDAR usando telhados de casas como exemplo para ver a altura do edifício.<\/P><\/P>Aqui está uma das camadas de cena dos Edifícios de Manitowac onde tiveram a ideia criativa de usar o mesmo lidar colorizado para dar lados falsos aos edifícios mostrando o lidar classificado como edifícios várias vezes, cada um com uma elevação ligeiramente menor alterando o deslocamento na simbologia. Mais adiante no blog, mostro como fazer isso.<\/P>
<\/P>
Cenas lidar do Condado de Mantiowoc:<\/STRONG><\/P>Alguns condados, cidades e estados já estão fazendo isso. O Condado de Manitowoc, WI., tem uma
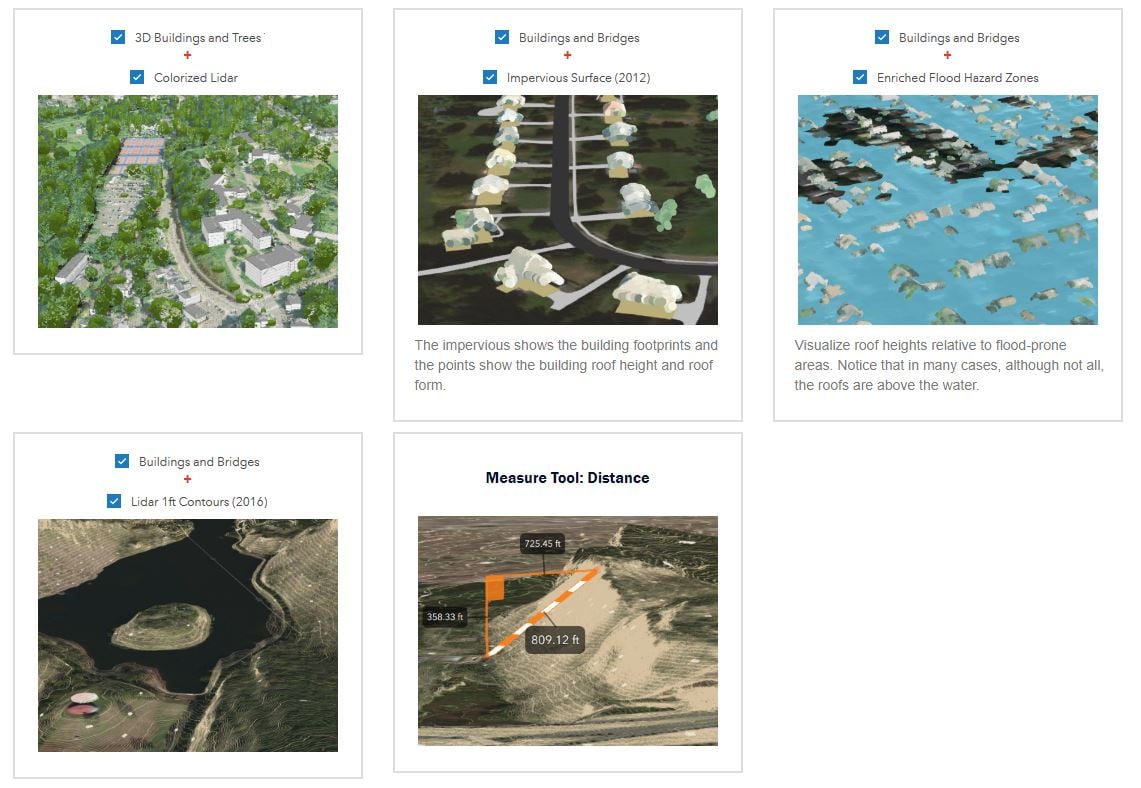
O StoryMap mostra com um vídeo como capturar distâncias verticais, horizontais e diretas das superfícies do solo LiDAR em qualquer local do condado. Como obter medições detalhadas de pequenas características da superfície LiDAR, como a profundidade de valas até a estrada. <\/P>
Meça distâncias nas nuvens de pontos LiDAR em relação às superfícies do solo LiDAR usando telhados de casas como exemplo para ver a altura do edifício.<\/P>
Aqui está uma das camadas de cena dos Edifícios de Manitowac onde tiveram a ideia criativa de usar o mesmo lidar colorizado para dar lados falsos aos edifícios mostrando o lidar classificado como edifícios várias vezes, cada um com uma elevação ligeiramente menor alterando o deslocamento na simbologia. Mais adiante no blog, mostro como fazer isso.<\/P>
Meus parabéns a Bruce Riesterer do Condado de Manitowoc que juntou tudo isso antes de se aposentar, incluindo a ideia de usar os pontos dos edifícios várias vezes com cores diferentes para mostrar os lados dos edifícios e agora está trabalhando para a indústria privada, veja seu novo trabalho em
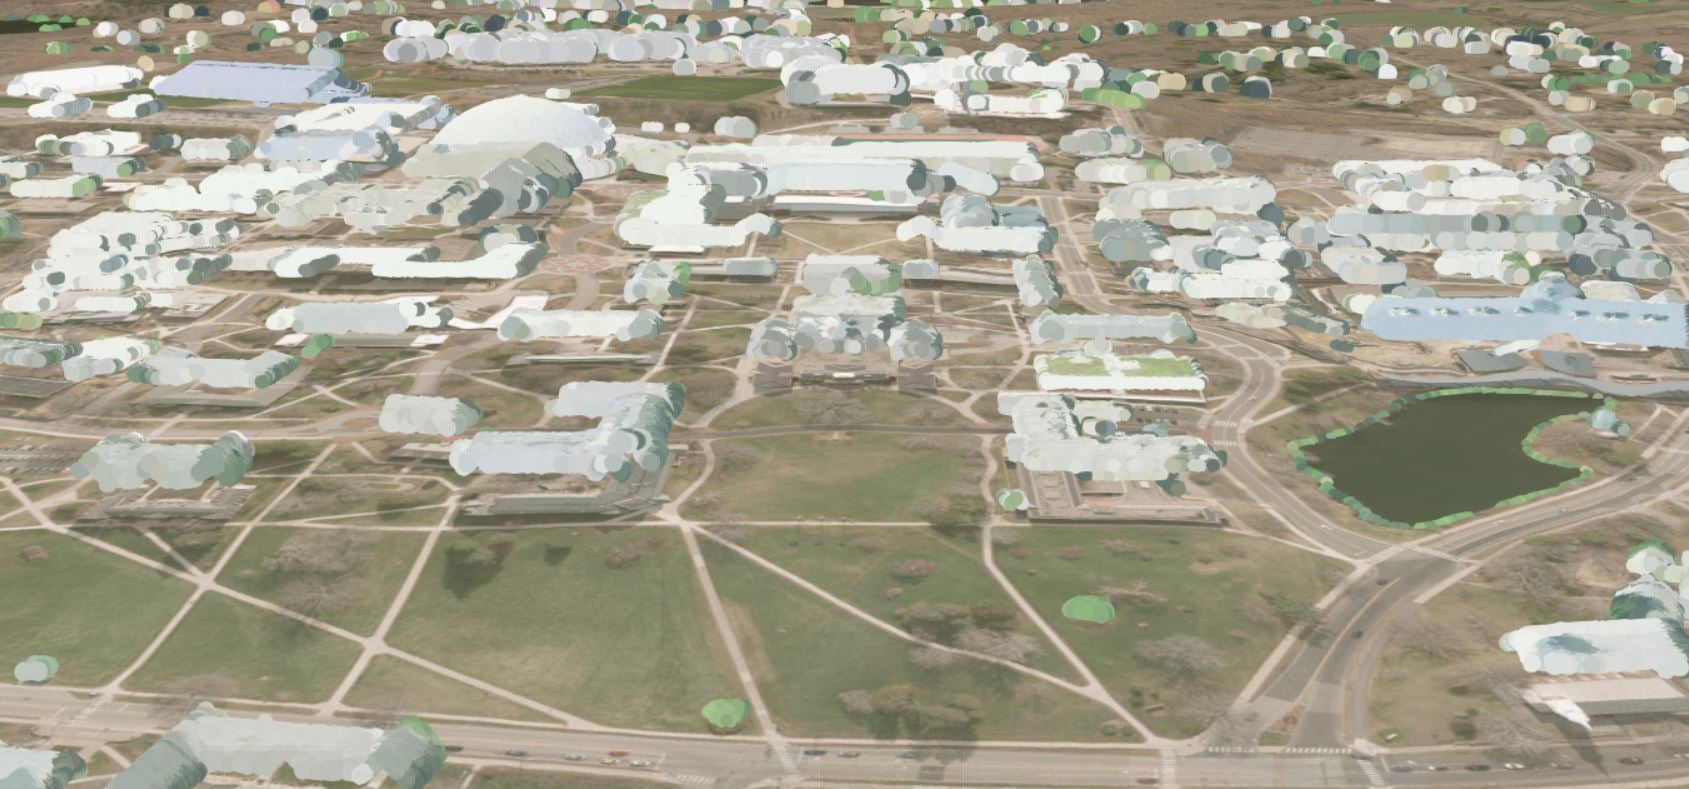
Aqui estão várias visualizações usando diferentes simbologias e filtros na nuvem de pontos lidar publicada para Connecticut.Colorido com NAIP:
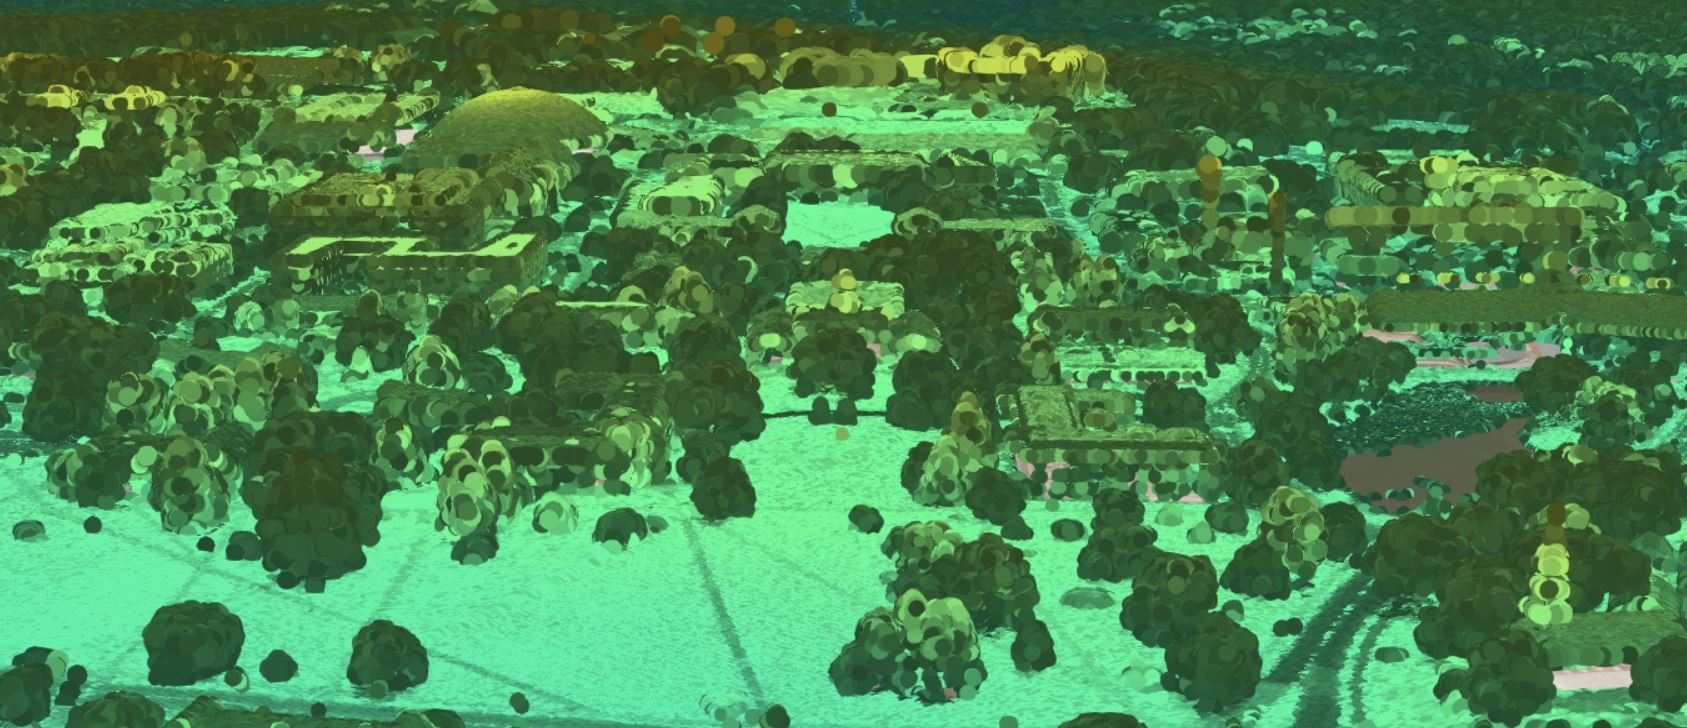
Código da Classe modulado com intensidade: A Intensidade Modulada permite que as elementos apareçam como estradas, calçadas, detalhes nos telhados e árvores.
Elevação modulada com intensidade:
Cor filtrada para mostrar edifícios:
Aqui estão alguns exemplos de como exibir do blog deles:
Alta Resolução com Folhas Presentes:<\/SPAN><\/SPAN><\/P><\/SPAN><\/P>NAIP com Folhas Presentes:<\/SPAN><\/P><\/SPAN><\/P>Alta Resolução com Folhas Ausentes:<\/SPAN><\/P><\/SPAN><\/P>Às vezes, imagens coloridas de outono antes das folhas caírem podem ser ótimas para cenas, mas tudo depende do que você quer mostrar.<\/SPAN><\/P><\/P>Forma de adicionar árvores com galhos e pontos como folhas:<\/STRONG><\/P>Aqui está um teste que fiz usando a simbologia Dead Tree para representar o tronco e os galhos, enquanto as folhas vêm do lidar colorizado. Minha ferramenta Trees from LIdar ou as ferramentas de árvore da Solução 3D Basemap podem criar as árvores a partir do lidar e então os pontos podem ser simbolizados com o símbolo Dead Tree. Esta imagem foi feita no ArcGIS Pro, não em uma cena.<\/P><\/P><\/P>Visualizador 3D da Cidade de Klaipėda (Lituânia):<\/STRONG><\/P>A
Aqui está outra vista afastada:<\/P>
E outra ainda mais afastada:<\/P>
Algumas das cenas acima usam imagens NAIP em vez de imagens de resolução mais alta. Por quê, quando a resolução mais alta está disponível? Frequentemente, imagens de alta resolução são um pouco oblíquas onde o NAIP é coletado geralmente de uma altitude maior. Com a altitude maior, você obtém menos inclinação dos edifícios nas imagens e frequentemente o espaçamento do lidar não suporta a imagem de resolução mais alta. Nesses casos, o NAIP é frequentemente preferido, mas faça nuvens de pontos com alguns arquivos las para ver quais são as diferenças.<\/P>
Aqui está uma sobre Fairfax County, VA, usando seu lidar colorizado publicado (do seu
Abaixo está um trabalho que ajudei o Estado de Kentucky. O resultado é ssemelhante em alguns aspectos ao trabalho dos neo-Impressionistas Georges Seurat e Paul Signac que pioneiraram uma técnica de pintura chamada Pontilhismo. <\/P>
Lidar colorizado Kentucky:<\/P>
Com a ilusão de paredes adicionada e telhado engrossado (Cumberland, KY):<\/P>
Aqui está outra vista mostrando os lados do edifício:<\/P>
É uma ilusão com os lados dos edifícios, as cores não correspondem ao lado real dos edifícios e as diferenças na intensidade do lidar usado não mostram as verdadeiras diferenças nos lados como as janelas percebidas acima. Como a maioria das ilusões ou representações, engana os olhos fazendo pensar que são os lados dos edifícios. Às vezes, como a maioria das ilusões ou representações, não funciona de todos os ângulos como este edifício fez com uma baixa quantidade de pontos:<\/P>
No geral, eu acho que os lados representativos ajudam você a identificar o que é um edifício e o que não é. As cores dos lados do edifício não corresponderão à realidade, nem não mostram verdadeiras janelas ou verdadeiras portas. Fazer isso geralmente é um processo muito caro e demorado após gerar modelos 3D dos edifícios. Você ainda pode gerar os edifícios 3D com a Local Government 3D Basemap Solution para ArcGIS Pro e tê-los semi-transparentes para usar em seleção e análise sem qualquer coloração. Você também pode usar rpks aplicados aos edifícios para representar os modelos 3D com mais precisão, mas isso novamente seria uma representação sem dados muito detalhados. <\/P>
Como obter Lidar facilmente para grandes áreas:<\/STRONG> Aqui está um
Cobrindo o básico de Nuvens de Pontos Lidar Colorizadas, criando pacotes de camadas de cena e visualizando:<\/STRONG><\/P>Aqui está um
Link:
Baía Barneget (New Jersey, EUA)
Nuvem de Pontos da Cidade de Denver (Colorado, EUA)
Cidade de Redlands (Califórnia, EUA)
Teste Lidar Kentucky (Cumberland, Kentucky, EUA)
Lewisville, TX, EUA (perto de Dallas)
Vou adicionar mais a este blog no futuro, fiquem ligados.
Arthur Crawford - Living Atlas\\Content Product Engineer
Hi! Interesting blog. I noticed you have Barnegat Bay Scene Viewer listed under the examples of some colorized lidar to look at. Barnegat Bay is in New Jersey, for those who are curious!
Hi Trish, thanks for the comment. I added the location to it.
Arthur
Hi Arthur - really interesting blog.
I have a question that is semi-related to your blog entry -- more specifically related to your #3 step towards the end of the blog: 3. Looked at the projection in the reports in the meta data downloaded and found it was not supported because it used meters instead of feet, modified a projection and then copied it using a simple model builder tool to give a projection file to each LAS file.
When you say "modified a projection", what exactly are you doing in ArcGIS Pro? I have a las file with a known projection and vertical coordinate system (NAD 1983 (2011) UTM Zone 18N, NAVD88 height - Geoid12A (metres)) but when I generate the las dataset it floats above the surface. This suggests to me that I have in an incorrect vertical reference so I'm trying to figure out how to modify the projection or reproject the lasd to get the stars to align.
See below.
Any thoughts?
Hello John,
What I did was saw the vertical projection in meters, but the one list was in feet. Here's the text in that projection file: USGS_LPC_CA_Wildfires_B1_2018_w1927n1436_LAS_2019.prj
PROJCS["NAD_1983_2011_Contiguous_USA_Albers",GEOGCS["GCS_NAD_1983_2011",DATUM["D_NAD_1983_2011",SPHEROID["GRS_1980",6378137.0,298.257222101,AUTHORITY["EPSG",7019]],AUTHORITY["EPSG",1116]],PRIMEM["Greenwich",0.0,AUTHORITY["EPSG",8901]],UNIT["Degree",0.0174532925199433,AUTHORITY["EPSG",9102]],AUTHORITY["EPSG",6318]],PROJECTION["Albers",AUTHORITY["Esri",43007]],PARAMETER["False_Easting",0.0,AUTHORITY["Esri",100001]],PARAMETER["False_Northing",0.0,AUTHORITY["Esri",100002]],PARAMETER["Central_Meridian",-96.0,AUTHORITY["Esri",100010]],PARAMETER["Standard_Parallel_1",29.5,AUTHORITY["Esri",100025]],PARAMETER["Standard_Parallel_2",45.5,AUTHORITY["Esri",100026]],PARAMETER["Latitude_Of_Origin",23.0,AUTHORITY["Esri",100021]],UNIT["Meter",1.0,AUTHORITY["EPSG",9001]],AUTHORITY["EPSG",6350]],VERTCS["NAVD88 (height) (ftUS)_1",VDATUM["North_American_Vertical_Datum_1988",AUTHORITY["EPSG",5103]],PARAMETER["Vertical_Shift",0.0,AUTHORITY["Esri",100006]],PARAMETER["Direction",1.0,AUTHORITY["Esri",100007]],UNIT["Meter",1.0,AUTHORITY["EPSG",9001]]]
Where the "Meter" is was originally "Feet", so I changed it. You can do this manually or in ArcGIS Pro by modifying the projection and saving it. I created a simple model with an iterator that would run through the las files and copy the projection file so it would match each las file.
It's looks to me yours might be in meters, but need to be set to feet, from the image you shared. Basically, the opposite of what I did with the Redlands lidar. You can create a projection file for one tile, change it from meters to feet and see if it works.
Here's one that might work, copy and paste below into a txt file. Then rename with las name and change from .txt file to .prj.
PROJCS["NAD_1983_2011_UTM_Zone_18N",GEOGCS["GCS_NAD_1983_2011",DATUM["D_NAD_1983_2011",SPHEROID["GRS_1980",6378137.0,298.257222101]],PRIMEM["Greenwich",0.0],UNIT["Degree",0.0174532925199433]],PROJECTION["Transverse_Mercator"],PARAMETER["False_Easting",500000.0],PARAMETER["False_Northing",0.0],PARAMETER["Central_Meridian",-75.0],PARAMETER["Scale_Factor",0.9996],PARAMETER["Latitude_Of_Origin",0.0],UNIT["Meter",1.0],AUTHORITY["EPSG",6347]],VERTCS["NAVD88_height_(ftUS)",VDATUM["North_American_Vertical_Datum_1988"],PARAMETER["Vertical_Shift",0.0],PARAMETER["Direction",1.0],UNIT["Foot_US",0.3048006096012192],AUTHORITY["EPSG",6360]]
I'll be on the question and answer team for the Imagery Showcase booth this year for Elevation and Lidar if you want to ask some questions in person.
Thanks,
Arthur Crawford
Living Atlas Team/Community Maps
Thanks Arthur!
I was able to resolve my vertical problem. I will seek out the Imagery Showcase booth (virtually) with other questions I have.
Speaking of which, I get to the Colorize Las stage of your workflow and no matter what adjustments I make to the tool settings, I still just end up with a grey colorized lasd. I'm thinking I must be missing something really basic but the solution hasn't been forthcoming! See attached.
It looks like you are using NAIP as an imagery source. Did you download the NAIP locally and is it matching the area of the point cloud?
Arthur Crawford - Esri
Thanks, Arthur. I did download the NAIP locally and it matched the area of the point cloud, so I'm not sure what the issue was.
However, I performed the same colorization using ESRI's NAIP service and it worked perfectly!
Thanks again.
Arthur CrawfordIs there a way to smooth multipatch?
Hi Rickey, good to hear from you. How's Ashland theses days? There is not a real good way to do that right now. It's something we have asked for, several universities and companies are working on. The goal would be to take a tin building and then flatten the roofs, superstructure and the sides of the buildings. I assume this is a building generated from a tin approach. There is some ideas of taking the planes generated to extend to the outside of the building polygon. Have you tried to segment roof tool with the Local Government 3D Basemap Solution?
Arthur Crawford
This was made from lidar points using LAS building Multipatch. I have tried different Simplification Tolerance but I have found one that works.
Hi Rickey,
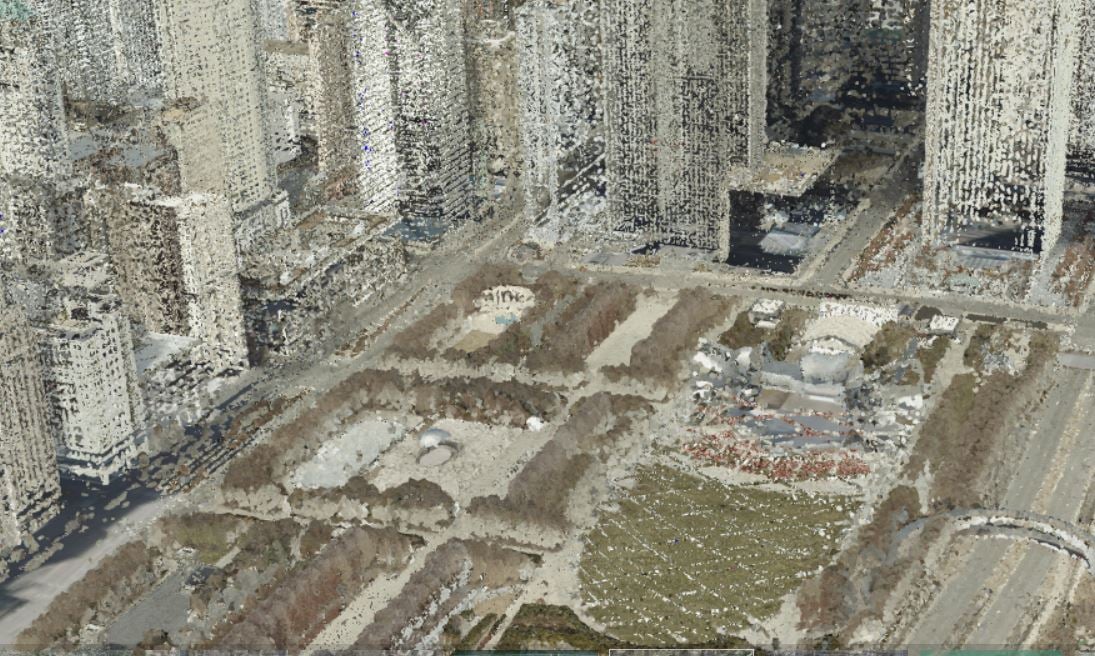
Is your intent to use the multipatches for analysis and use a colorized point cloud for rendering? I did something like that for Chicago using the LOD1/LOD2 buildings with a transparency. With the 3D trees in as multipatches as per the Local Government 3D Basemap, you could do some nice 3D analysis like line of sight or flood estimations with it. With both set to a 100% transparency, then use the point cloud for rendering quickly.
At this point whatever I can display nicely online is what I will go with.
Hi @ArthurCrawford,
Very cool looking scenes!
Can you colorize a point cloud scene layer with imagery?
Simon
@ArthurCrawford I wanted to share the St. Louis imagery web app linked in the blog (https://www.arcgis.com/home/webscene/viewer.html?webscene=6ece8b4050294139969fc4c10ad6b9b1) with my students in a Geovisualization and Cartography class. When we log in to our org we can see it, but we get a few layers that are "service not found" or "You do not have permission to access this resource". They are:
St Louis Iconic Waterfront Features 3D
City of St. Louis Lidar Dec 2016 Colorized
CityofStLouis_6_27_2018
Was trying to show them how the Colorize LAS tool worked and our computers were not happy (end of semester and not great graphics cards) but the colorized lidar was not showing up in this. 🙂 Thanks in advance.
Best, @shannonhwhite (not sure why its not defaulting to my wm-gis org account but either way I will get it).
Membros conectados podem postar, seguir atualizações e mais. Novo aqui? Registre uma conta gratuita.
Find useful guides, FAQs, and documents to help you navigate and make the most of Esri Community.