I have a point feature class with related table saved in AGOL that has historic surveyed values with a date field.
I've been configuring the pop-up to show the numeric values in related table as a line chart media, and faced with two issues.
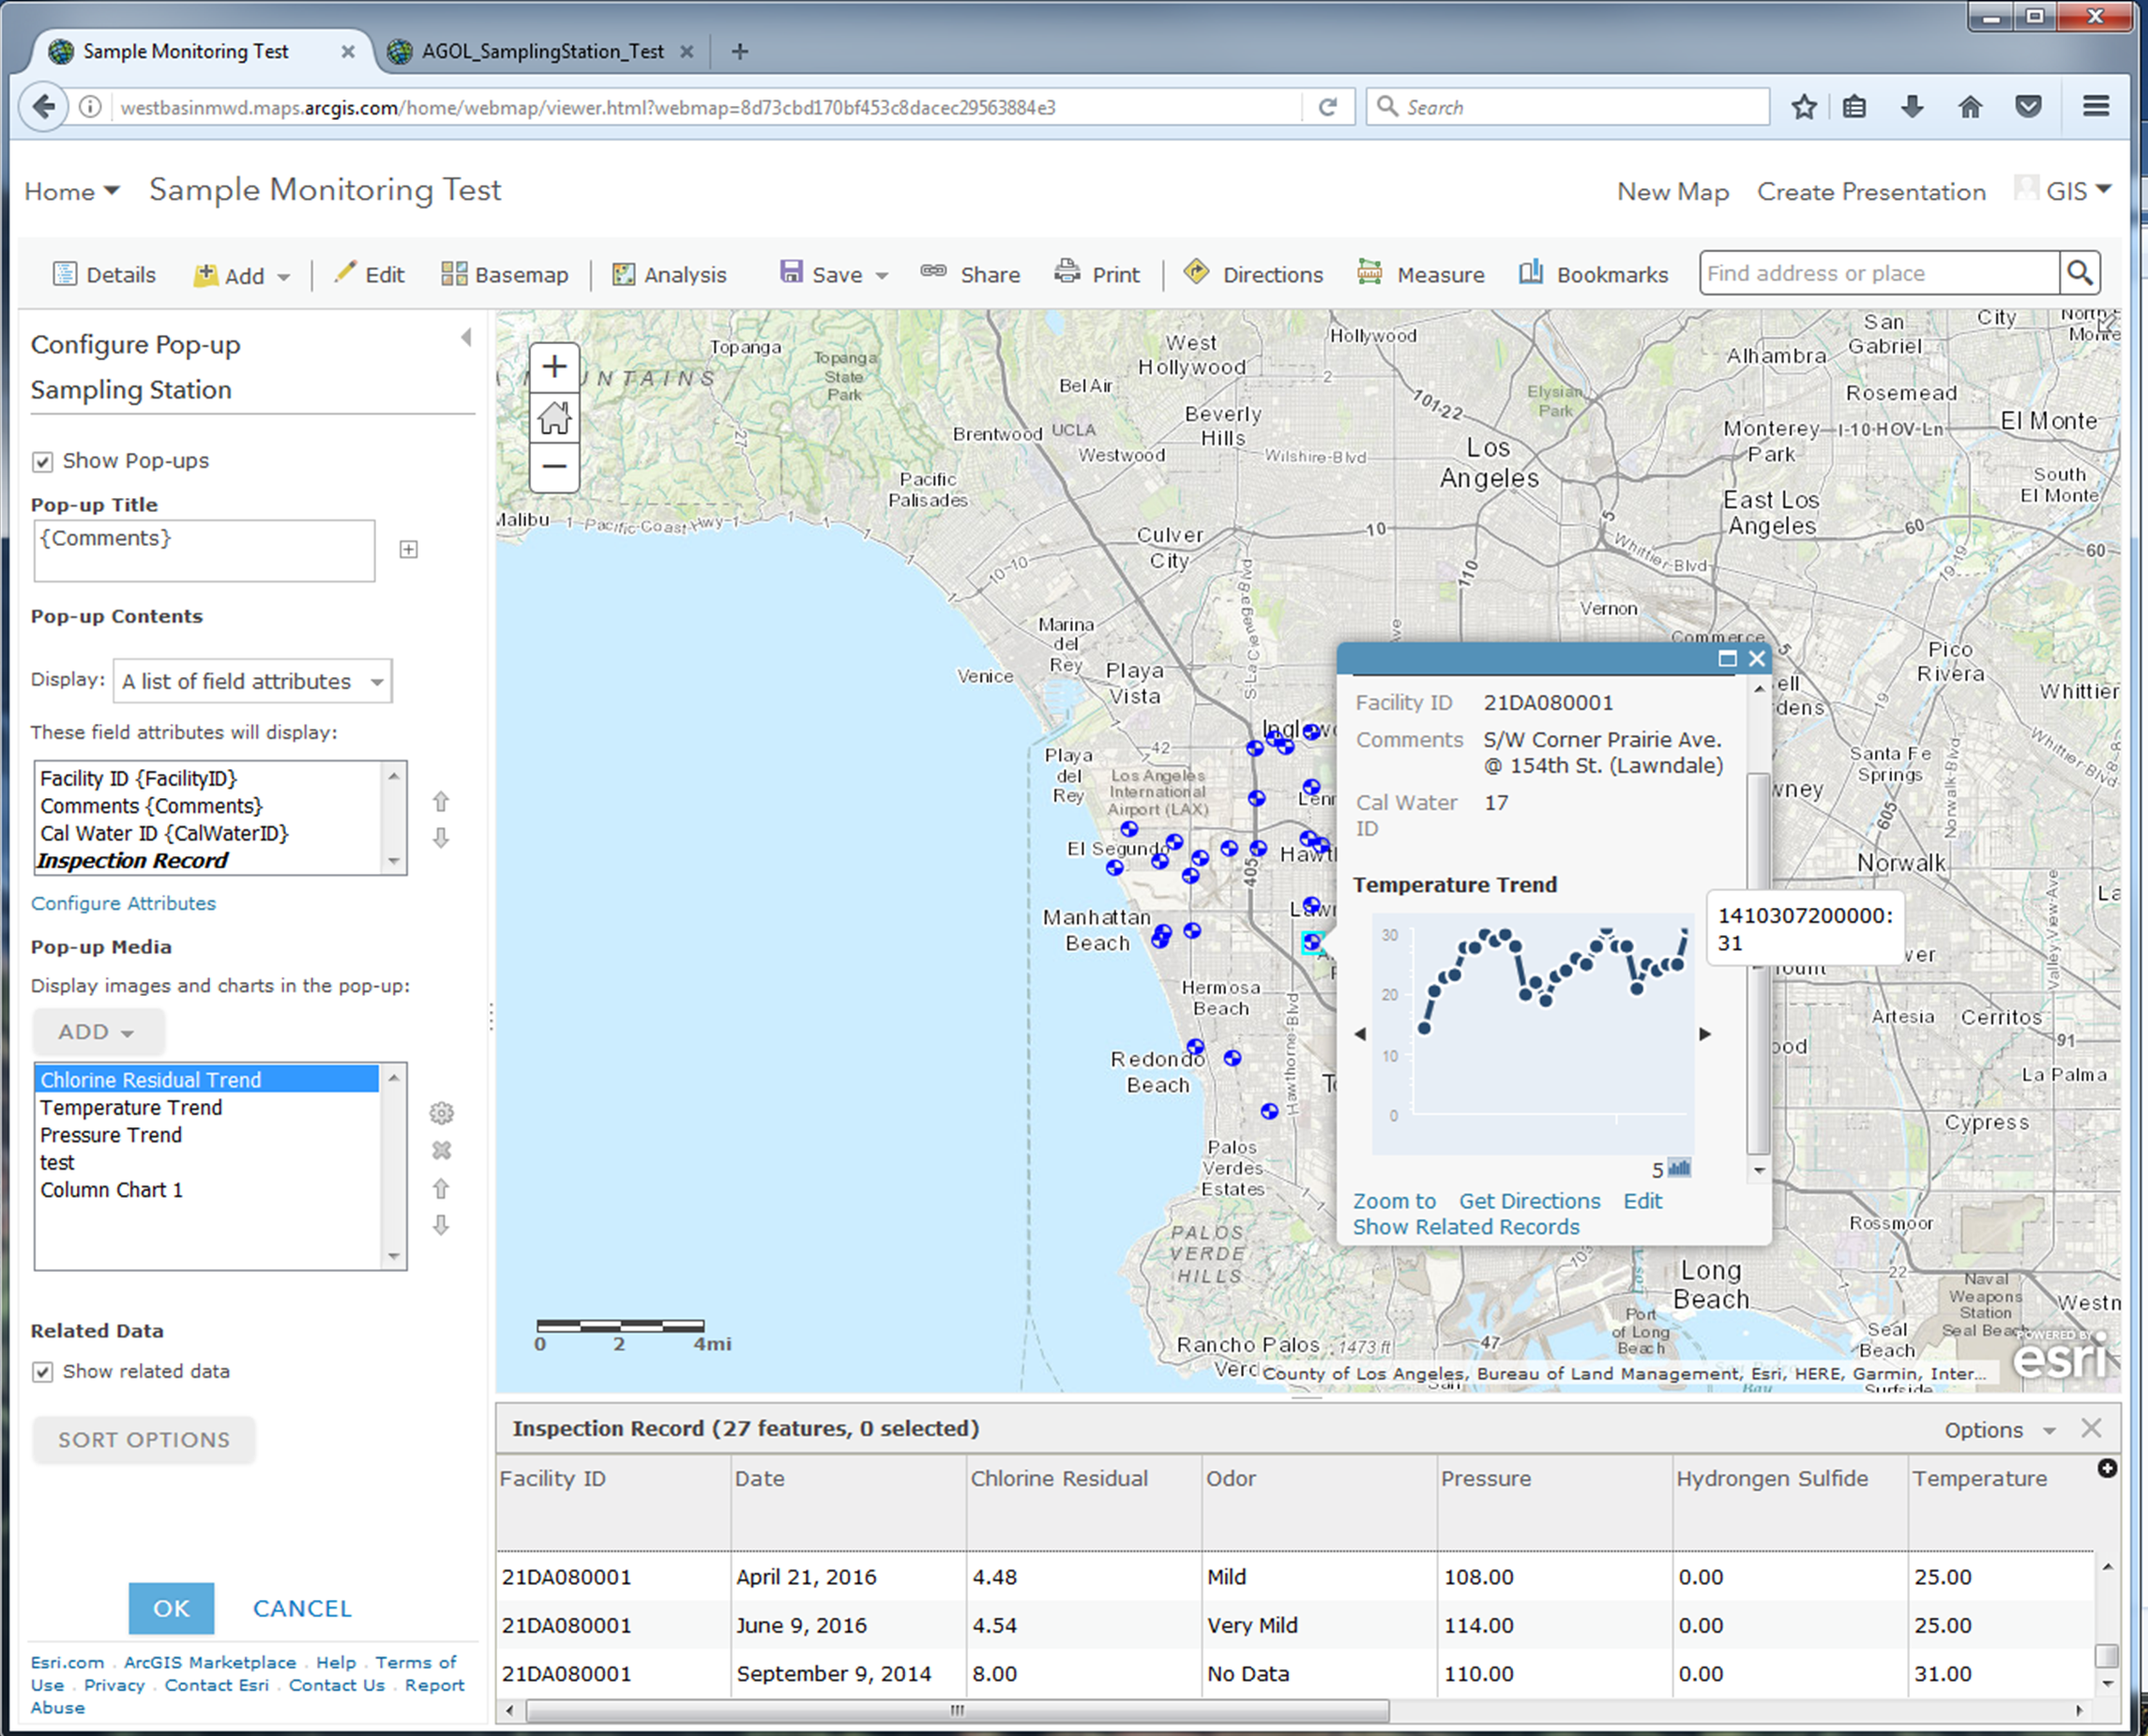
- Date Field cannot be configured to ascending/descending order when designing the chart.
Is there a way to configure the related table's date field to show the chart in temporal manner?
As you can see in records, the dates are not in order and the chart can be misleading - Date Field displays as 13-digit numeric values when the mouse hovers
When a mouse hovers on a chart, the value "September 9, 2014" displays as "1410307200000"
Any suggestions or guidance would be grateful.





