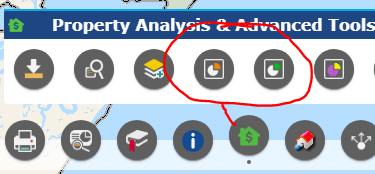
The Charting widget has a white text label color over the background, making it hard to see a bar's address and value (in my example SAGIS Property Map Viewer -> Charts are in Advanced Tools ) when you hover over an individual bar. Can this be changed and where? And I would recommend for Esri to add this as a user-changeable parameter in the Chart Widget's Config GUI. Jianxia Song
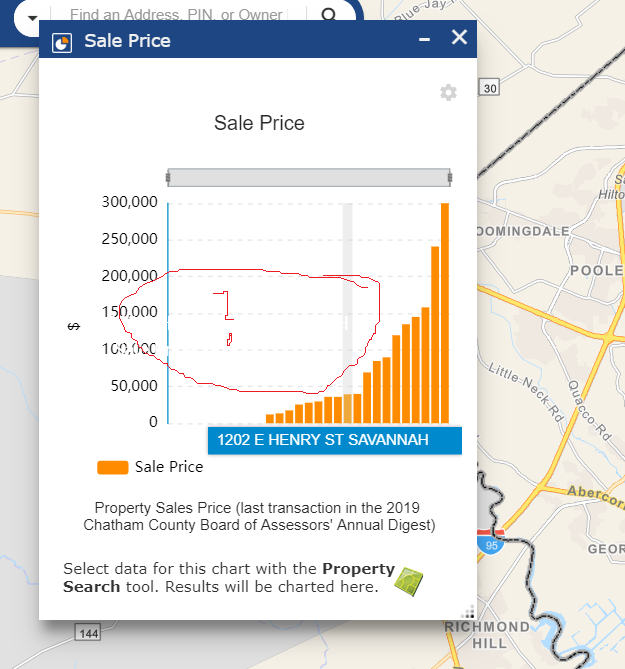
the white text is circled in Red. Kind of hard to see to even demonstrate this point, but... you can see why it is an issue...

