Hi folks,
the options you have in the operations dashboard to display data are really plenty. I like the documentation on Indicator data Indicator—Operations Dashboard for ArcGIS | Documentation but was wondering how do I need to store the data actually if I want to display them like in the last example with the raise or drop compared to the last day (or year in my case).
I have for example Green house gas emissions for 2006 to 2015 for a country (plus a couple of other data in that context). For each year I have the current value and the difference to the previous year as well as the difference compared to 2006. At the moment I have the data stored duplicating the polygon of my country having for each year a polygon and then the actual data as attributes per year.
I have seen that I can use different data sources for my reference value but none of these options would allow me to select the value of the previous year as it is stored in a separate feature.
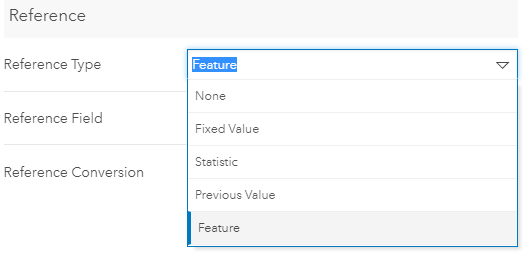
Any hint how to better organize my data to make use of this functionality?

