The recent update to MapMaker added some useful new features to help students have more control over their map real estate and explore data in more detail:
- You can now change the location of the attribute table to side by side with the map
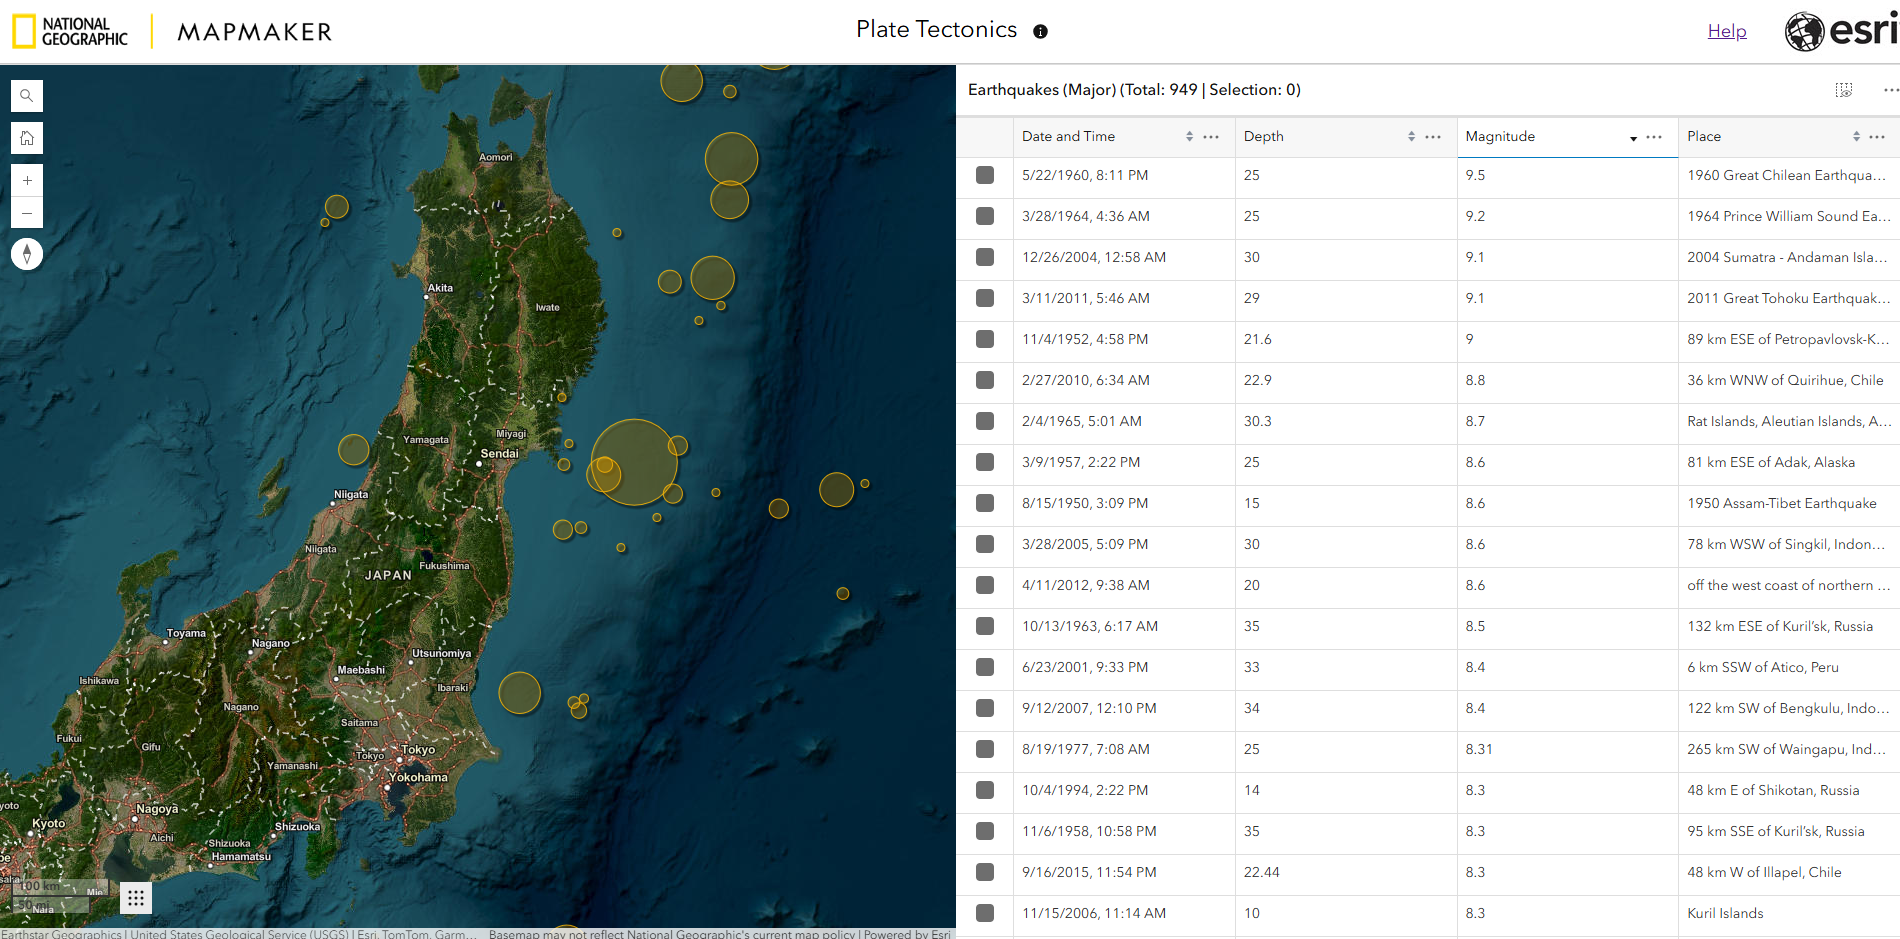
- When you zoom into a map you can now filter the map data by the extent.
- Selected data in the attribute table can be exported as a CSV file for use in graphing or charting with other applications.
Take a look at the video below to see a walk through of the workflow for these new features:
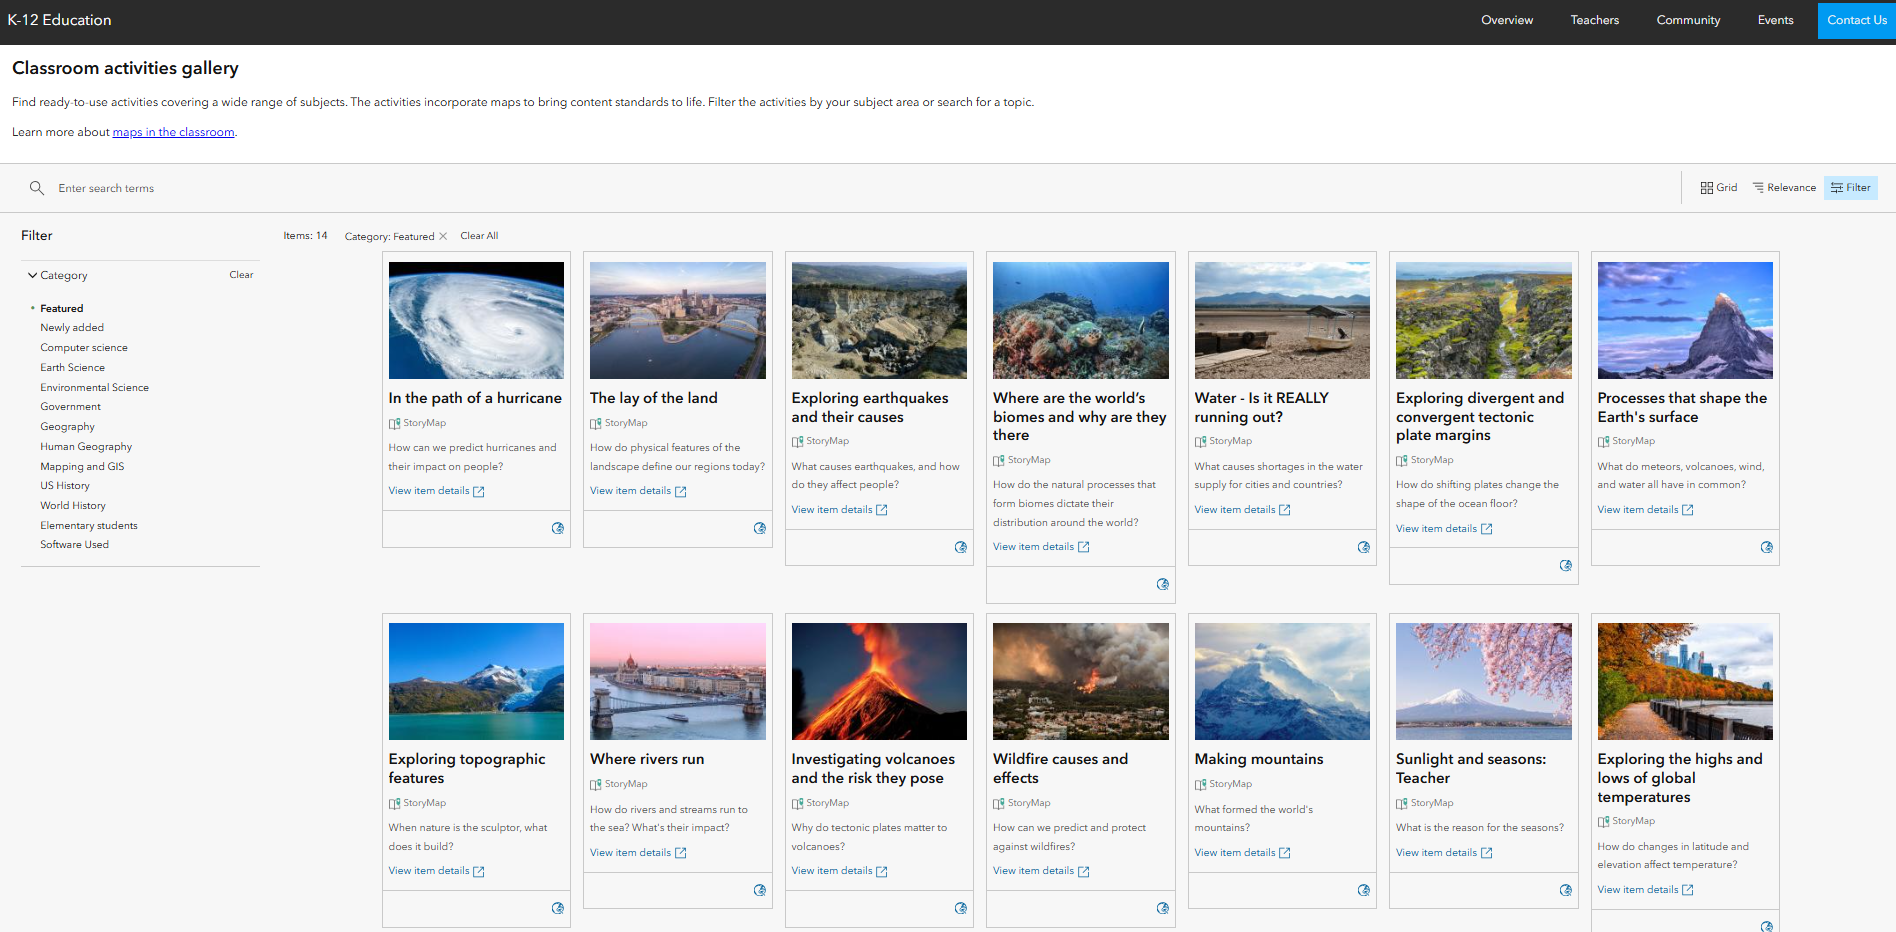
Also, don't forget to check out the new Classroom Activity Gallery for the latest MapMaker inquiry based activities and resources for your teaching: