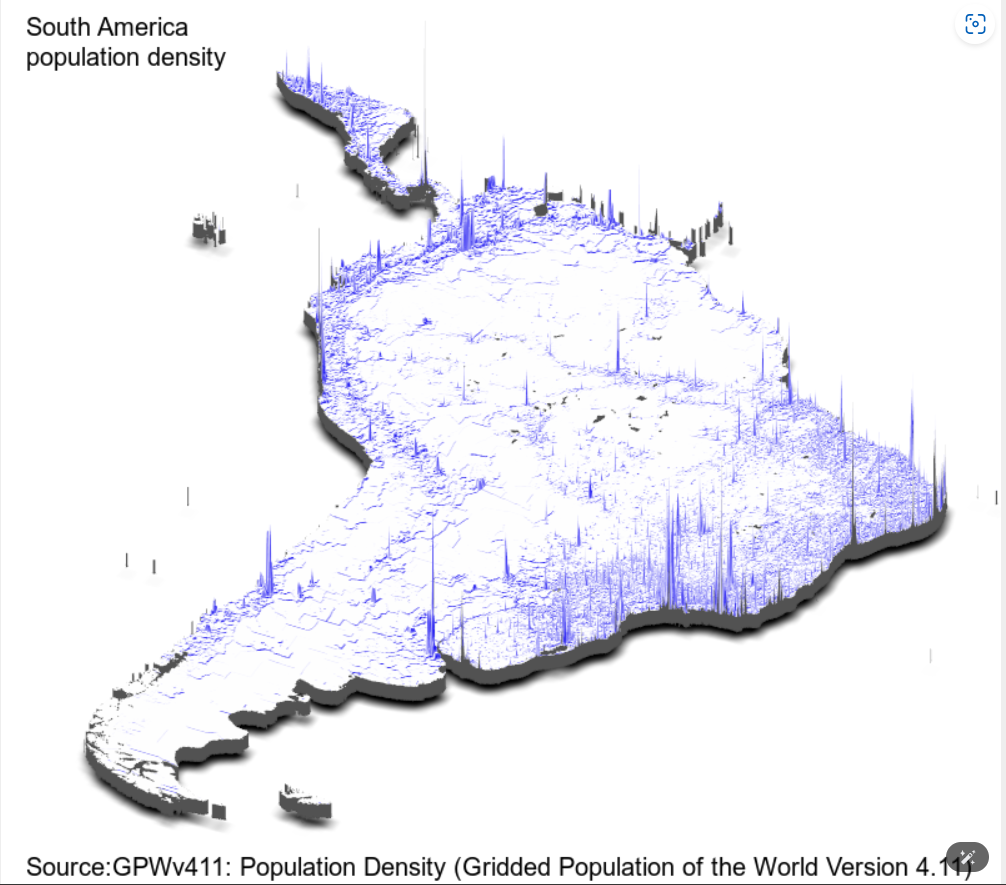
The python code I have been using looks like below and it gives me a map skipping the basemap completely and very high error bars. I am trying to figure out what am I missing import arcpy
import pandas as pd
import numpy as np
import matplotlib.pyplot as plt
from matplotlib.colors import ListedColormap
import os
from mpl_toolkits.mplot3d import Axes3D # Import for 3D plotting
# Switch to 'Agg' backend for non-interactive use, better for saving figures
import matplotlib
matplotlib.use('Agg')
# Input file paths
raster_a_path = r"C:\Users\xyz\ xyz \ xyz \ xyz \ xyz.tif"
raster_c_path = r"C:\ Users\xyz\ xyz \ xyz \ xyz \ xyz.tif"
csv_path = r"C:\ Users\xyz\ xyz \ xyz \ xyz \ xyz.csv"
output_folder = r"C:\ Users\xyz\ xyz \ xyz \ xyz \ xyz”
# Load the CSV file containing land use types and colors
legend_df = pd.read_csv(csv_path)
legend_df['LandUseType'] = legend_df['LandUseType'].str.strip() # Clean up data
# Ensure all color codes are valid hexadecimal
def validate_color(color):
if isinstance(color, str) and color.startswith('#') and len(color) == 7:
try:
int(color[1:], 16) # Try converting from hex to RGB
return True
except ValueError:
return False
return False
legend_df = legend_df[legend_df['Color'].apply(validate_color)]
# Convert values and colors to a dictionary
value_to_color = dict(zip(legend_df['Value'], legend_df['Color']))
# Convert colors to RGB tuples for use with matplotlib, adjust brightness for 3D bars
colors_rgb = [tuple(min(int(color.strip("#")[i:i+2], 16) / 255.0 * 1.5, 1.0) for i in (0, 2, 4)) for color in legend_df['Color']]
cmap = ListedColormap(colors_rgb)
# Load raster datasets
raster_a = arcpy.Raster(raster_a_path)
raster_c = arcpy.Raster(raster_c_path)
# Convert raster_a and raster_c to NumPy arrays
raster_a_array = arcpy.RasterToNumPyArray(raster_a)
raster_c_array = arcpy.RasterToNumPyArray(raster_c)
# Check if dimensions match
if raster_a_array.shape != raster_c_array.shape:
raise ValueError(f"Dimensions of raster_a ({raster_a_array.shape}) and raster_c ({raster_c_array.shape}) do not match")
# Mask NoData values (-9999) in raster_a
no_data_value = -9999
raster_a_masked = np.ma.masked_equal(raster_a_array, no_data_value)
# Adjust extent based on the raster's spatial reference
extent = [raster_a.extent.XMin, raster_a.extent.XMax, raster_a.extent.YMin, raster_a.extent.YMax]
# Plot Raster A in 2D
fig = plt.figure(figsize=(10, 10))
ax_2d = fig.add_subplot(111)
img_2d = ax_2d.imshow(raster_a_masked, cmap=cmap, extent=extent, interpolation='none')
# Overlay Raster C in 3D (vertical bars)
ax_3d = fig.add_subplot(111, projection='3d')
# Create grid for raster_c
x = np.arange(raster_c_array.shape[1])
y = np.arange(raster_c_array.shape[0])
x, y = np.meshgrid(x, y)
# Normalize height of 3D bars to a reasonable scale
heights = raster_c_array / np.nanmax(raster_c_array) * 10 # Scale heights for visibility
# Plot each bar as a vertical block
for i in range(raster_c_array.shape[0]):
for j in range(raster_c_array.shape[1]):
if raster_c_array[i, j] != no_data_value:
ax_3d.bar3d(x[i, j], y[i, j], 0, 1, 1, heights[i, j],
color=cmap(raster_c_array[i, j] % len(colors_rgb)), alpha=0.5)
# Set aspect ratios and remove the 3D axis, background grids, and labels
ax_3d.set_axis_off()
# Set the view angle for 3D projection
ax_3d.view_init(elev=50, azim=-60)
# Pause to ensure rendering completes before saving
plt.draw()
plt.pause(0.1)
# Construct the full path for saving the plot
output_path = os.path.join(output_folder, "output_base_map_with_3D_overlay.png")
# Save the plot to the specified folder
plt.savefig(output_path, bbox_inches='tight', dpi=300)
print(f"Plot saved successfully to: {output_path}")