Hi Guys,
I am trying to symbolize survey points that were installed by certain year using Arcade expression:
var revegDate = Date($feature.Date)
if (revegDate >= Date(2022,01,01) && revegDate <= Date(2022,12,31))
{
return "2022"
}
else if (revegDate >= Date(2023,01,01) && revegDate <= Date(2023,12,31))
{
return "2023"
}
else
{
return "2019"
}
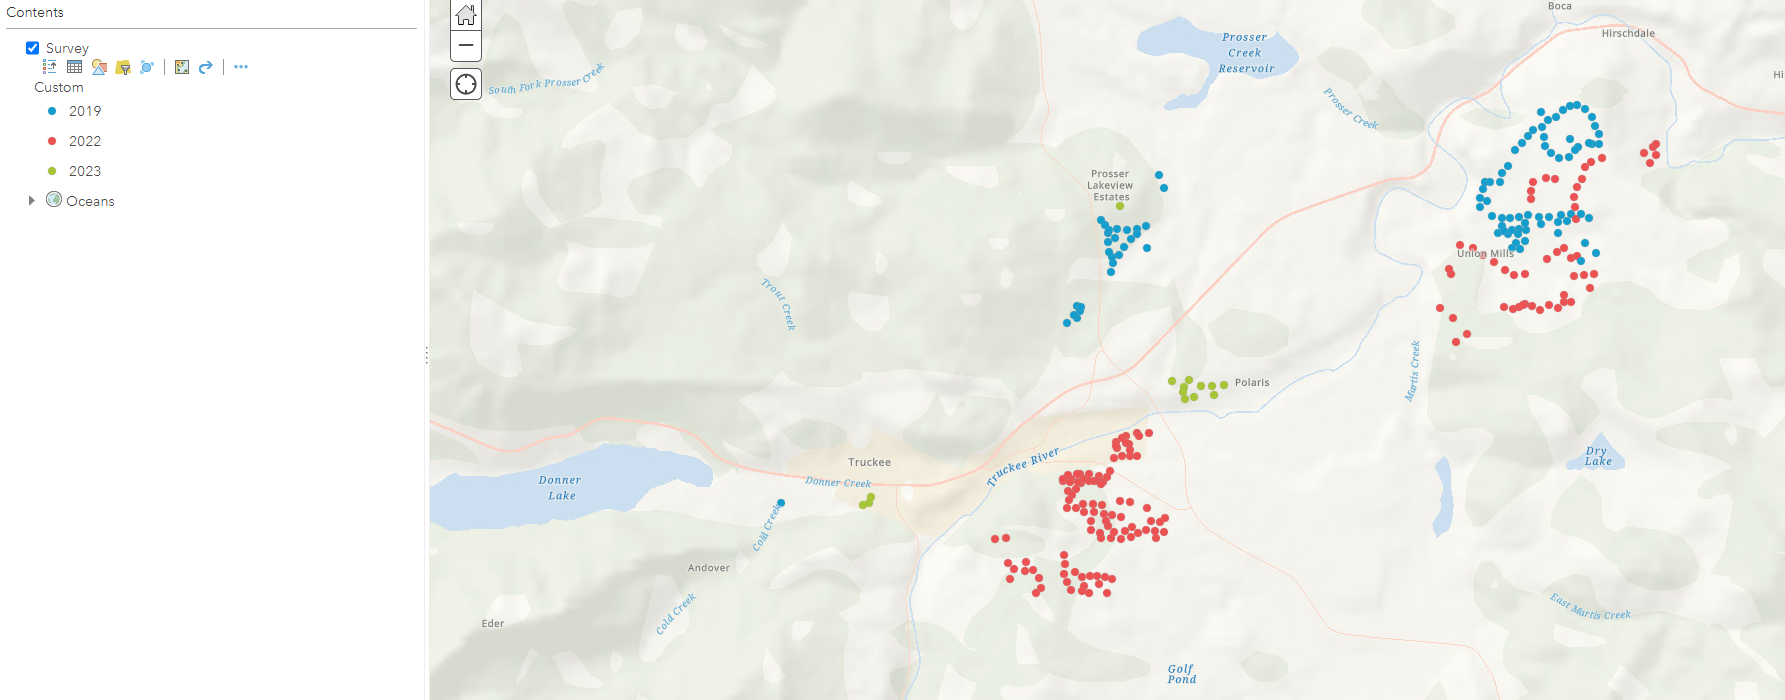
The expression doesn't return any errors but my points are not properly colored by year. I should have only one point installed in 2019 (blue). Majority of my survey points were installed in 2022 (243 of them). So, I should mostly see red dots. Only 14 points were installed in 2023 (green) which is the only year displayed correctly. See a snapshot below:
All data is being entered the same way - it's a download from a handheld device. Please don't advise ideas such as add another field and populate with proper year. I will be downloading this data on a regular basis. Hence, I want to avoid the manual process as much as I can.
Any ideas what's wrong with my expression or why my points are not symbolized correctly?



