The following code shows 2 layers. Each of them containing features with the same coordinates.
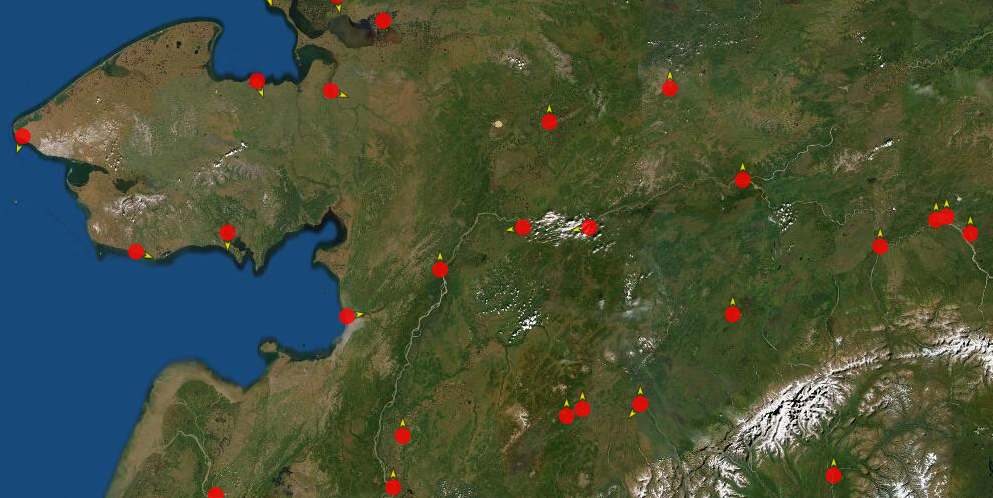
The goal of these featues is #1 to display a coordinate (red point) and #2 display a fixed direction from this coordinate (yellow arrow).
What I noticed is, when you change the value of 'field' (field: WIND_DIRECT) in the visualVariable array, the arrow turns/points in the direction on its own axis, as expected. However, when you define an offset (y or x, in this case yoffset) in the symbol (in this case the arrow, to make it visible behind the red dot), the arrow then doesn't rotates on its own axis anymore but rotates around the red dot (or the defined coordinate).
So my question is, is it possible to give the arrow an offset of (e.g. yoffset: 10 ) but at a fixed position next to the red dot? -So that the arrow still recieves values through the WIND_DIRECT field, but then rotating itself around its own axis, at a fixed position next to the red dot.
Note: I've already tried a few solutions to fix this, and adjusting the angle in the symbol is currently not an option
The Problem (arrow rotates around the red dot and not staying at a fixed position next to it, when changing the rotationExpression/field value):
<html>
  <head>
    <meta charset="utf-8" />
    <meta
      name="viewport"
      content="initial-scale=1, maximum-scale=1,user-scalable=no"
    />
    <title>
      Visualize data with rotation | Sample | ArcGIS API for JavaScript 4.23
    </title>

    <style>
      html,
      body,
      #viewDiv {
        height: 100%;
        width: 100%;
        margin: 0;
        padding: 0;
      }
    </style>

    <link
      rel="stylesheet"
      href="https://js.arcgis.com/4.23/esri/themes/light/main.css"
    />
    <script src="https://js.arcgis.com/4.23/"></script>

    <script>
      require(["esri/Map", "esri/views/MapView", "esri/layers/FeatureLayer"], (
        Map,
        MapView,
        FeatureLayer
      ) => {
        const symbolArrow = {
          type: "simple-marker",
          path: "M14.5,29 23.5,0 14.5,9 5.5,0z",
          color: "#ffff00",
          outline: {
            color: [0, 0, 0, 0.7],
            width: 0.5
          },
          angle: 180,
          size: 15,
          yoffset: 15
        };
        let symbolRedDot = {
          type: "simple-marker",
          color: "red",
          outline: {
          color: [ 128, 128, 128, 1 ],
            outline: {
            color: [0, 0, 0, 0.7],
            width: 0.5
          },
          width: "0.1px"
          }
        };
        const rotationRendererYellow = {
          type: "simple",
          symbol: symbolArrow,
          visualVariables: [
            {
              type: "rotation",
              field: "WIND_DIRECT",
              rotationType: "geographic"
            },
            {
              type: "size",
              field: "WIND_SPEED",
              minDataValue: 0,
              maxDataValue: 60,
              minSize: 10,
              maxSize: 10,
            }
          ]
        };
        const rotationRendererRed = {
          type: "simple",
          symbol: symbolRedDot,
        };

        const layerRed = new FeatureLayer({
          url: "https://services.arcgis.com/V6ZHFr6zdgNZuVG0/arcgis/rest/services/weather_stations_010417/FeatureServer/0",
          renderer: rotationRendererRed
        });
        const layerYellow = new FeatureLayer({
          url: "https://services.arcgis.com/V6ZHFr6zdgNZuVG0/arcgis/rest/services/weather_stations_010417/FeatureServer/0",
          renderer: rotationRendererYellow
        });

        const map = new Map({
          basemap: "satellite",
          layers: [layerYellow, layerRed]
        });

        const view = new MapView({
          container: "viewDiv",
          map: map,
          extent: {
            spatialReference: { wkid: 3857 },
            xmin: -41525513,
            ymin: 4969181,
            xmax: -36687355,
            ymax: 9024624
          }
        });
      });
    </script>
  </head>
  <body>
    <div id="viewDiv"></div>
  </body>
</html>


