Hi, thanks for reading:
I´m trying to create a serial chart that allowed me to display the sum of a project, accumulating progress day by day. for example: 01/01/2021: 220 meters -> 02/01/2021: 320 (100 meters from 02/01/2021 + 220 meters from 01/01/2021), and so on. That would be really helpfull as is a really common chart in project management.
It was already asked in the community a year ago without a directa solution(https://community.esri.com/t5/arcgis-dashboards-questions/esri-dashboard-create-cumulative-chart/td-p/177802) but I´m wondering if the new arcade Dashboard expression could solve this.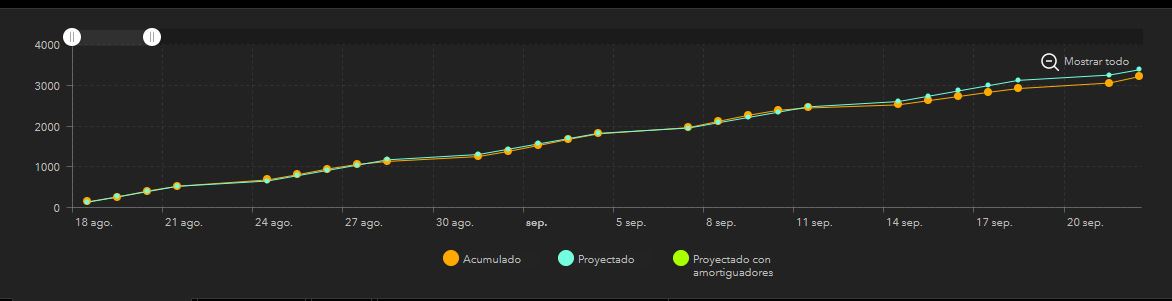
thanks a lot.








