Hi everyone,
Does any one know if there is a way of creating in ArcGIS Dashboards (even in the Beta version) a scatter graph (from an serial widget) like this:
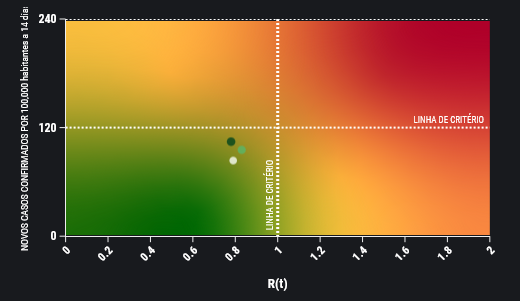
It would be great if we could define an image to be used as the graph background (instead of only be able to define a color).
I know it can be done embeding an image but we need it to be dynamic and read from the data.
Thanks in advance!
António

