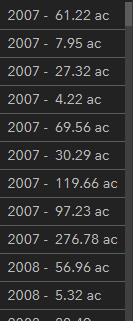
I think the answer is that it can't be done, but I wanted to check before I wrote it off and moved on.
Ok, so I am building a dashboard with several lists that respond to the selection on a map. I am trying to replicate an offline workflow for displaying data to a client (think Pivot table but more complex). In this list, I really would like to get those acre values summarized by the years to the left. As far as I know, only HTML can be used to format these lists in the RTE, and I know HTML cannot do a groupby like this. Is there any other way to do it? Is there another tool to use to do it within AGO? Currently it is displaying a line per record.